29
/
en
AIzaSyAYiBZKx7MnpbEhh9jyipgxe19OcubqV5w
April 1, 2024
161402
Italy
ITA
true
2
1
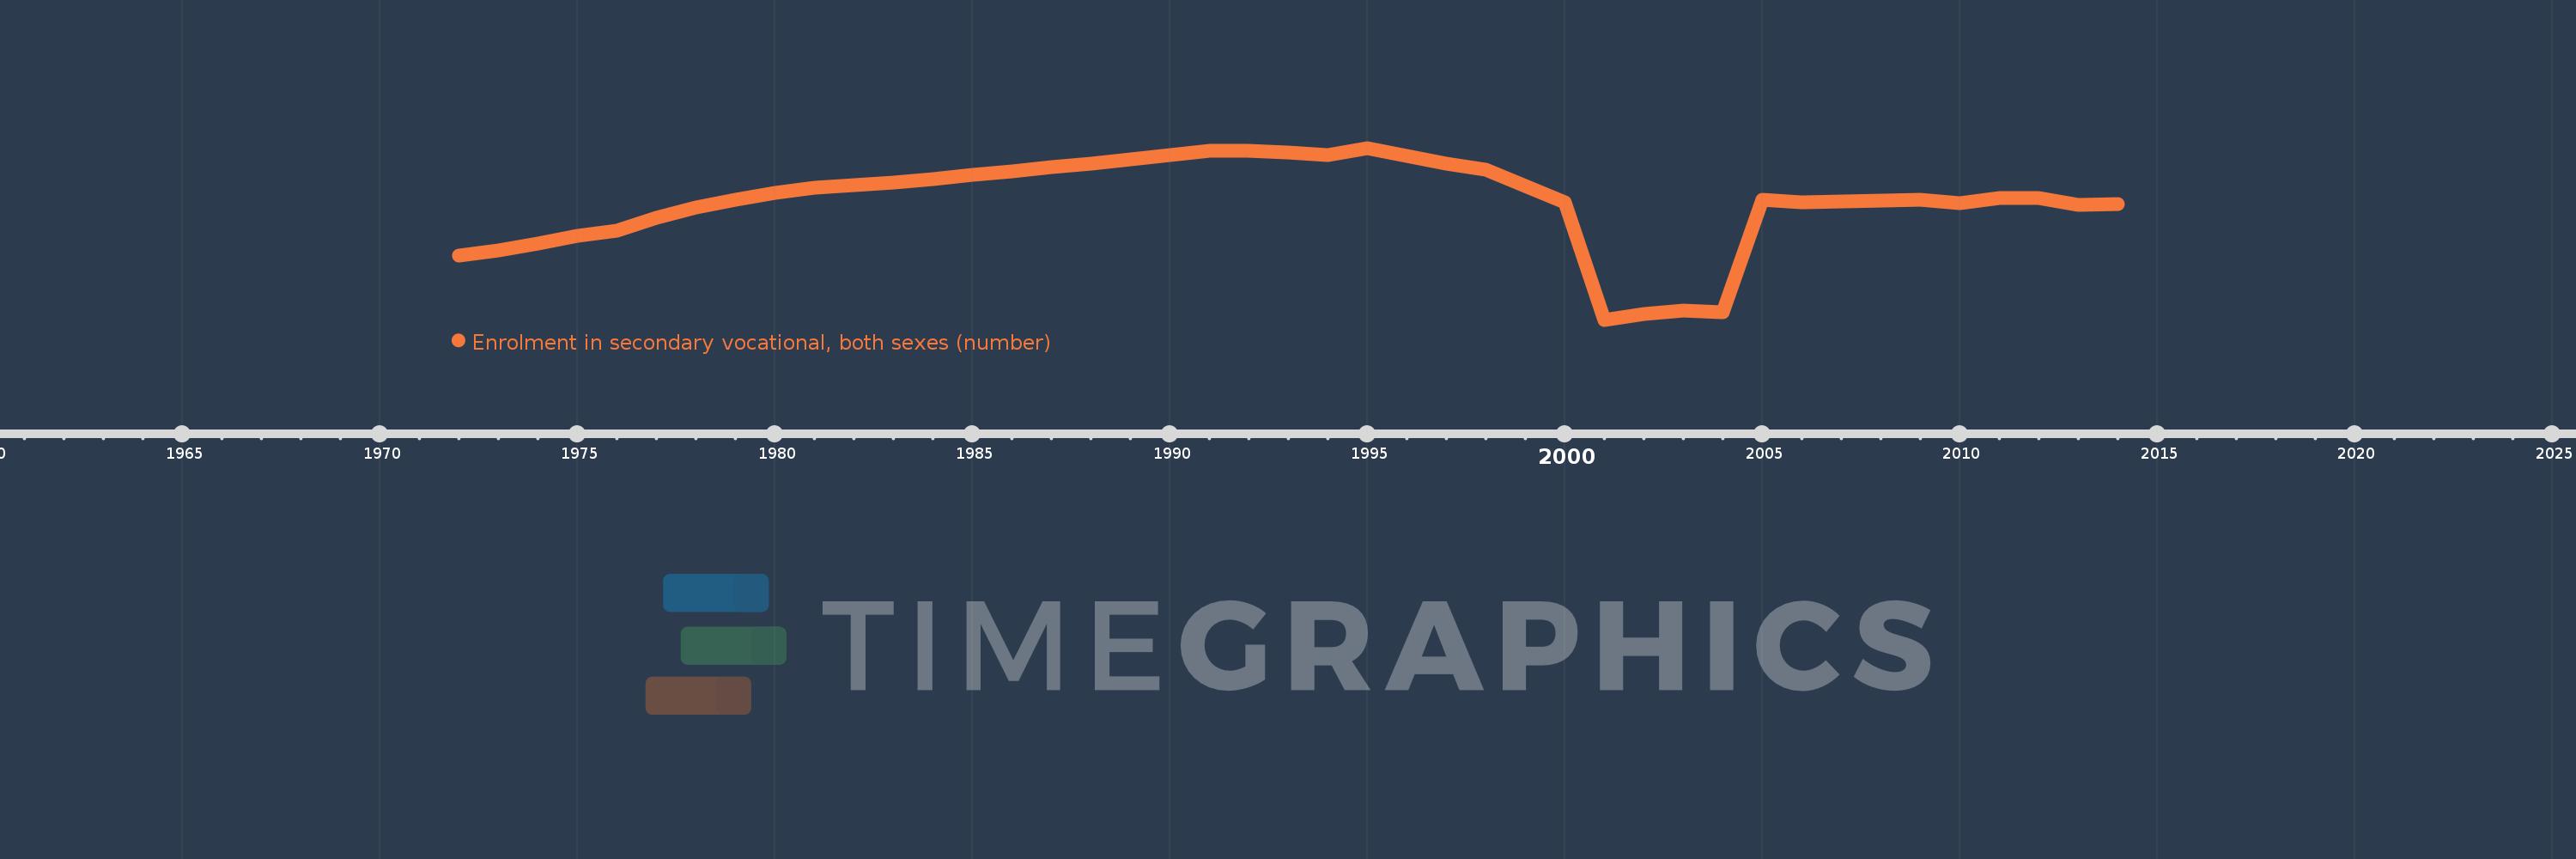
Enrolment in secondary vocational, both sexes (number)
2014,2013,2012,2011,2010,2009,2008,2007,2006,2005,2004,2003,2002,2001,2000,1998,1997,1996,1995,1994,1993,1992,1991,1990,1989,1988,1987,1986,1985,1984,1983,1982,1981,1980,1979,1978,1977,1976,1975,1974,1973,1972
This statistics in other country:
AfghanistanAlbaniaAlgeriaAmerican SamoaAndorraAngolaAntigua and BarbudaArab WorldArgentinaArmeniaArubaAustraliaAustriaAzerbaijanBahamas, TheBahrainBangladeshBarbadosBelarusBelgiumBelizeBeninBermudaBhutanBoliviaBosnia and HerzegovinaBotswanaBrazilBritish Virgin IslandsBrunei DarussalamBulgariaBurkina FasoBurundiCabo VerdeCambodiaCameroonCanadaCaribbean small statesCayman IslandsCentral African RepublicCentral Europe and the BalticsChadChileChinaColombiaComorosCongo, Dem. Rep.Congo, Rep.Costa RicaCote d'IvoireCroatiaCubaCuracaoCyprusCzech RepublicDenmarkDjiboutiDominicaDominican RepublicEarly-demographic dividendEast Asia & PacificEast Asia & Pacific (excluding high income)East Asia & Pacific (IDA & IBRD countries)EcuadorEgypt, Arab Rep.El SalvadorEquatorial GuineaEritreaEstoniaEthiopiaEuro areaEurope & Central AsiaEurope & Central Asia (excluding high income)Europe & Central Asia (IDA & IBRD countries)European UnionFaroe IslandsFijiFinlandFragile and conflict affected situationsFranceFrench PolynesiaGabonGambia, TheGeorgiaGermanyGhanaGibraltarGreeceGrenadaGuamGuatemalaGuineaGuinea-BissauGuyanaHaitiHeavily indebted poor countries (HIPC)High incomeHondurasHong Kong SAR, ChinaHungaryIBRD onlyIcelandIDA & IBRD totalIDA blendIDA onlyIDA totalIndiaIndonesiaIran, Islamic Rep.IraqIrelandIsraelItalyJamaicaJapanJordanKazakhstanKenyaKiribatiKorea, Rep.KuwaitKyrgyz RepublicLao PDRLate-demographic dividendLatin America & Caribbean Latin America & Caribbean (excluding high income)Latin America & the Caribbean (IDA & IBRD countries)LatviaLeast developed countries: UN classificationLebanonLesothoLiberiaLibyaLiechtensteinLithuaniaLow & middle incomeLow incomeLower middle incomeLuxembourgMacao SAR, ChinaMacedonia, FYRMadagascarMalawiMalaysiaMaldivesMaliMaltaMarshall IslandsMauritaniaMauritiusMexicoMicronesia, Fed. Sts.Middle East & North AfricaMiddle East & North Africa (excluding high income)Middle East & North Africa (IDA & IBRD countries)Middle incomeMoldovaMonacoMongoliaMontenegroMoroccoMozambiqueMyanmarNamibiaNauruNepalNetherlandsNew CaledoniaNew ZealandNicaraguaNigerNigeriaNorth AmericaNorwayOECD membersOmanOther small statesPacific island small statesPakistanPanamaPapua New GuineaParaguayPeruPhilippinesPolandPortugalPost-demographic dividendPre-demographic dividendPuerto RicoQatarRomaniaRussian FederationRwandaSamoaSan MarinoSao Tome and PrincipeSaudi ArabiaSenegalSerbiaSeychellesSierra LeoneSingaporeSint Maarten (Dutch part)Slovak RepublicSloveniaSmall statesSolomon IslandsSomaliaSouth AfricaSouth AsiaSouth Asia (IDA & IBRD)SpainSri LankaSt. Kitts and NevisSt. LuciaSt. Vincent and the GrenadinesSub-Saharan Africa Sub-Saharan Africa (excluding high income)Sub-Saharan Africa (IDA & IBRD countries)SudanSurinameSwazilandSwedenSwitzerlandSyrian Arab RepublicTajikistanTanzaniaThailandTimor-LesteTogoTongaTrinidad and TobagoTunisiaTurkeyTurkmenistanTurks and Caicos IslandsTuvaluUgandaUkraineUnited Arab EmiratesUnited KingdomUnited StatesUpper middle incomeUruguayUzbekistanVanuatuVenezuela, RBVietnamVirgin Islands (U.S.)West Bank and GazaWorldYemen, Rep.ZambiaZimbabwe Timeline:
This timeline shows a graph from 1972 to 2014 of Italy. No data until 1971. Number of actual observations by date: 42.
Source name:
World Development Indicators
Source organization:
UNESCO Institute for Statistics
Categories, topics:
Education
Last updated:
apr 23, 2017
Indicators value changes by year
Minimum:
636.068K
jan 1, 2001
Maximum:
2.15 mln
jan 1, 1995
At the date of observation
Value
Absolute change
Change from previous value
jan 1, 1972
1.198 mln
+1.198 mln
0.0%
jan 1, 1973
1.248 mln
+49.646K
4.14%
jan 1, 1974
1.31 mln
+62.008K
4.97%
jan 1, 1975
1.373 mln
+63.223K
4.83%
jan 1, 1976
1.42 mln
+47.683K
3.47%
jan 1, 1977
1.532 mln
+111.645K
7.86%
jan 1, 1978
1.622 mln
+90.145K
5.88%
jan 1, 1979
1.693 mln
+70.636K
4.35%
jan 1, 1980
1.755 mln
+62.115K
3.67%
jan 1, 1981
1.797 mln
+42.119K
2.4%
jan 1, 1982
1.824 mln
+26.541K
1.48%
jan 1, 1983
1.848 mln
+24.228K
1.33%
jan 1, 1984
1.873 mln
+25.607K
1.39%
jan 1, 1985
1.911 mln
+37.55K
2.0%
jan 1, 1986
1.943 mln
+31.761K
1.66%
jan 1, 1987
1.98 mln
+37.349K
1.92%
jan 1, 1988
2.012 mln
+31.554K
1.59%
jan 1, 1989
2.048 mln
+36.164K
1.8%
jan 1, 1990
2.088 mln
+40.628K
1.98%
jan 1, 1991
2.128 mln
+39.636K
1.9%
jan 1, 1992
2.123 mln
-5.187K
-0.24%
jan 1, 1993
2.11 mln
-12.587K
-0.59%
jan 1, 1994
2.087 mln
-23.317K
-1.1%
jan 1, 1995
2.15 mln
+62.763K
3.01%
jan 1, 1996
2.081 mln
-68.346K
-3.18%
jan 1, 1997
2.012 mln
-69.144K
-3.32%
jan 1, 1998
1.96 mln
-52.522K
-2.61%
jan 1, 2000
1.668 mln
-291.434K
-14.87%
jan 1, 2001
636.068K
-1.032 mln
-61.87%
jan 1, 2002
688.093K
+52.025K
8.18%
jan 1, 2003
720.344K
+32.251K
4.69%
jan 1, 2004
698.717K
-21.627K
-3.0%
jan 1, 2005
1.696 mln
+996.932K
142.68%
jan 1, 2006
1.669 mln
-26.24K
-1.55%
jan 1, 2007
1.676 mln
+6.15K
0.37%
jan 1, 2008
1.687 mln
+11.86K
0.71%
jan 1, 2009
1.69 mln
+3.064K
0.18%
jan 1, 2010
1.663 mln
-27.917K
-1.65%
jan 1, 2011
1.709 mln
+46.213K
2.78%
jan 1, 2012
1.705 mln
-3.376K
-0.2%
jan 1, 2013
1.647 mln
-58.433K
-3.43%
jan 1, 2014
1.653 mln
+5.577K
0.34%
Ranking of countries by current statistics by years


Comments: