29
/
en
AIzaSyAYiBZKx7MnpbEhh9jyipgxe19OcubqV5w
April 1, 2024
130379
Ethiopia
ETH
true
2
1
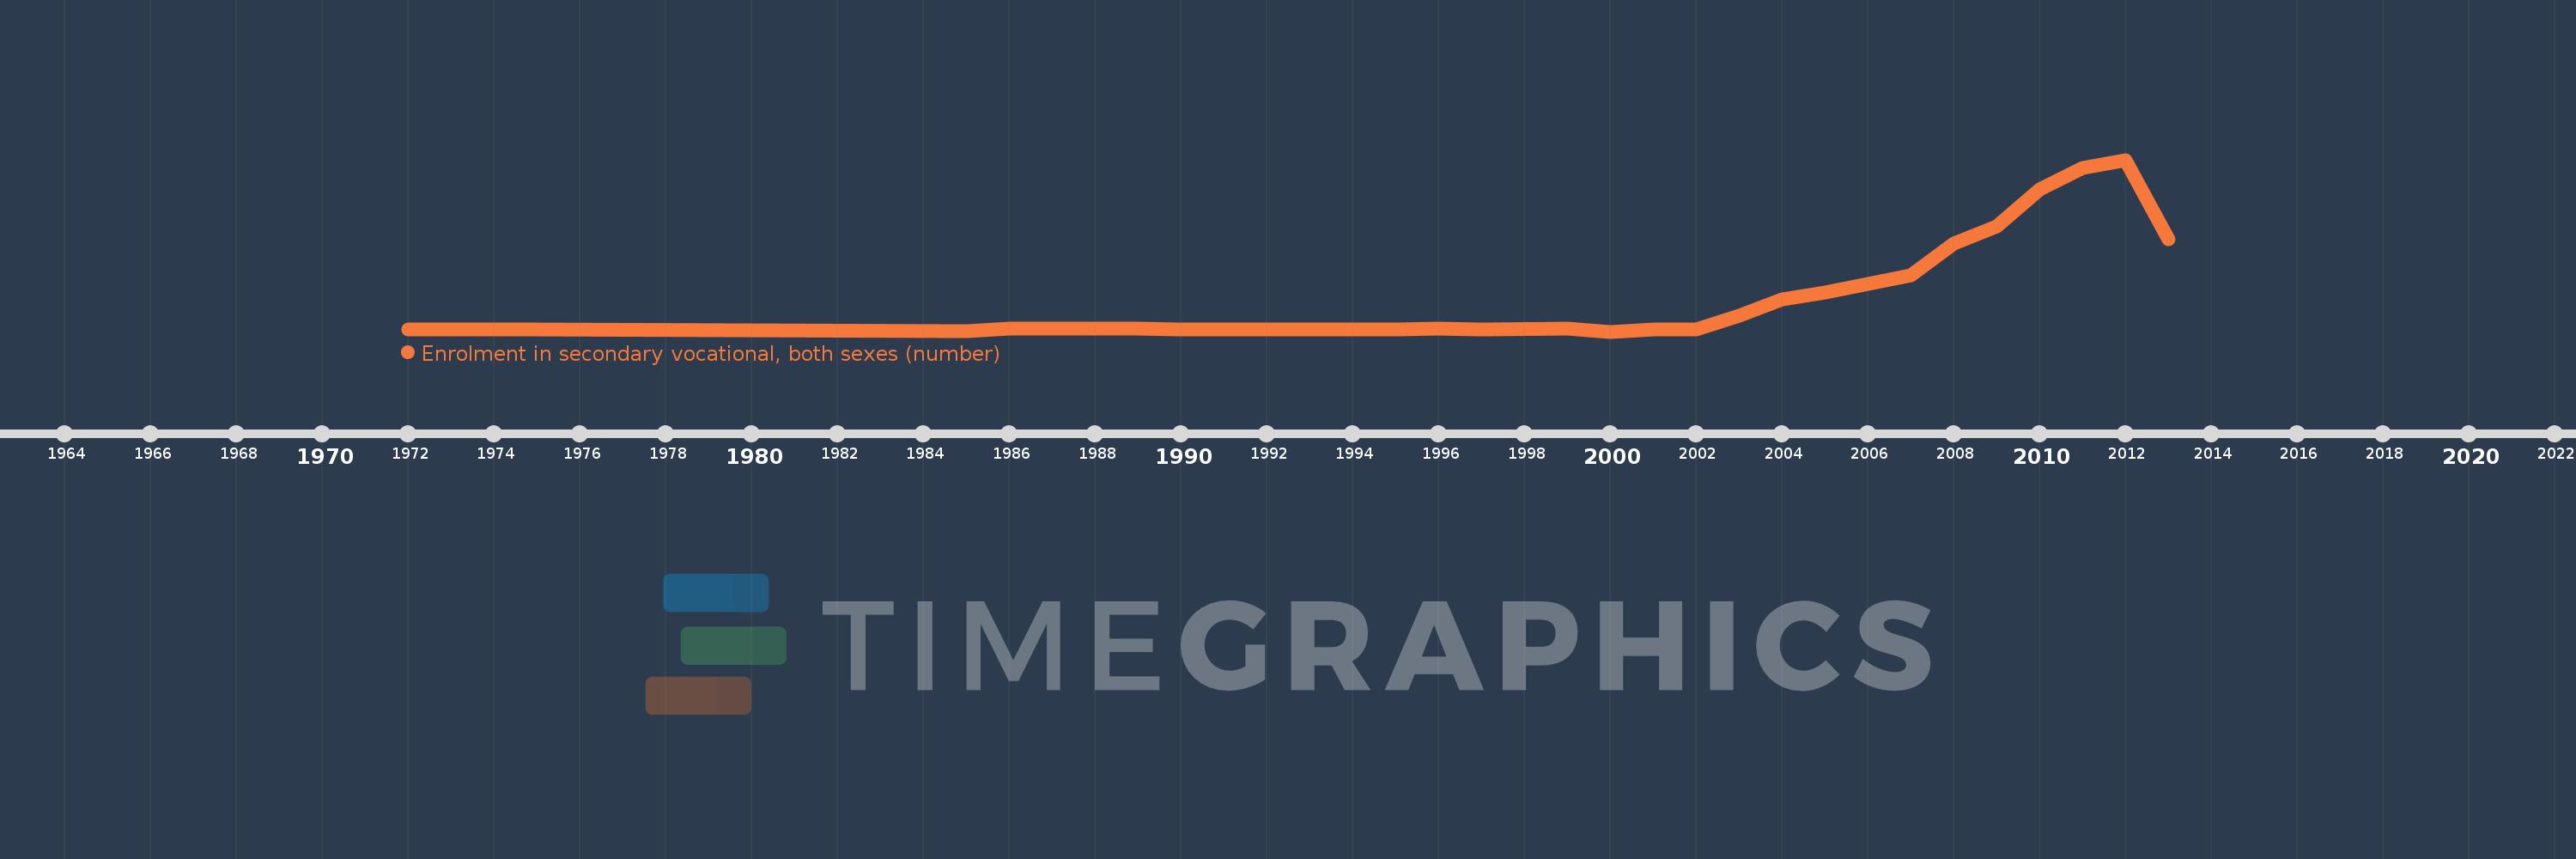
Enrolment in secondary vocational, both sexes (number)
2013,2012,2011,2010,2009,2008,2007,2006,2005,2004,2003,2002,2001,2000,1999,1997,1996,1995,1994,1993,1992,1990,1989,1988,1987,1986,1985,1975,1974,1973,1972
This statistics in other country:
AfghanistanAlbaniaAlgeriaAmerican SamoaAndorraAngolaAntigua and BarbudaArab WorldArgentinaArmeniaArubaAustraliaAustriaAzerbaijanBahamas, TheBahrainBangladeshBarbadosBelarusBelgiumBelizeBeninBermudaBhutanBoliviaBosnia and HerzegovinaBotswanaBrazilBritish Virgin IslandsBrunei DarussalamBulgariaBurkina FasoBurundiCabo VerdeCambodiaCameroonCanadaCaribbean small statesCayman IslandsCentral African RepublicCentral Europe and the BalticsChadChileChinaColombiaComorosCongo, Dem. Rep.Congo, Rep.Costa RicaCote d'IvoireCroatiaCubaCuracaoCyprusCzech RepublicDenmarkDjiboutiDominicaDominican RepublicEarly-demographic dividendEast Asia & PacificEast Asia & Pacific (excluding high income)East Asia & Pacific (IDA & IBRD countries)EcuadorEgypt, Arab Rep.El SalvadorEquatorial GuineaEritreaEstoniaEthiopiaEuro areaEurope & Central AsiaEurope & Central Asia (excluding high income)Europe & Central Asia (IDA & IBRD countries)European UnionFaroe IslandsFijiFinlandFragile and conflict affected situationsFranceFrench PolynesiaGabonGambia, TheGeorgiaGermanyGhanaGibraltarGreeceGrenadaGuamGuatemalaGuineaGuinea-BissauGuyanaHaitiHeavily indebted poor countries (HIPC)High incomeHondurasHong Kong SAR, ChinaHungaryIBRD onlyIcelandIDA & IBRD totalIDA blendIDA onlyIDA totalIndiaIndonesiaIran, Islamic Rep.IraqIrelandIsraelItalyJamaicaJapanJordanKazakhstanKenyaKiribatiKorea, Rep.KuwaitKyrgyz RepublicLao PDRLate-demographic dividendLatin America & Caribbean Latin America & Caribbean (excluding high income)Latin America & the Caribbean (IDA & IBRD countries)LatviaLeast developed countries: UN classificationLebanonLesothoLiberiaLibyaLiechtensteinLithuaniaLow & middle incomeLow incomeLower middle incomeLuxembourgMacao SAR, ChinaMacedonia, FYRMadagascarMalawiMalaysiaMaldivesMaliMaltaMarshall IslandsMauritaniaMauritiusMexicoMicronesia, Fed. Sts.Middle East & North AfricaMiddle East & North Africa (excluding high income)Middle East & North Africa (IDA & IBRD countries)Middle incomeMoldovaMonacoMongoliaMontenegroMoroccoMozambiqueMyanmarNamibiaNauruNepalNetherlandsNew CaledoniaNew ZealandNicaraguaNigerNigeriaNorth AmericaNorwayOECD membersOmanOther small statesPacific island small statesPakistanPanamaPapua New GuineaParaguayPeruPhilippinesPolandPortugalPost-demographic dividendPre-demographic dividendPuerto RicoQatarRomaniaRussian FederationRwandaSamoaSan MarinoSao Tome and PrincipeSaudi ArabiaSenegalSerbiaSeychellesSierra LeoneSingaporeSint Maarten (Dutch part)Slovak RepublicSloveniaSmall statesSolomon IslandsSomaliaSouth AfricaSouth AsiaSouth Asia (IDA & IBRD)SpainSri LankaSt. Kitts and NevisSt. LuciaSt. Vincent and the GrenadinesSub-Saharan Africa Sub-Saharan Africa (excluding high income)Sub-Saharan Africa (IDA & IBRD countries)SudanSurinameSwazilandSwedenSwitzerlandSyrian Arab RepublicTajikistanTanzaniaThailandTimor-LesteTogoTongaTrinidad and TobagoTunisiaTurkeyTurkmenistanTurks and Caicos IslandsTuvaluUgandaUkraineUnited Arab EmiratesUnited KingdomUnited StatesUpper middle incomeUruguayUzbekistanVanuatuVenezuela, RBVietnamVirgin Islands (U.S.)West Bank and GazaWorldYemen, Rep.ZambiaZimbabwe Timeline:
This timeline shows a graph from 1972 to 2013 of Ethiopia. No data until 1971. Number of actual observations by date: 31.
Source name:
World Development Indicators
Source organization:
UNESCO Institute for Statistics
Categories, topics:
Education
Last updated:
apr 23, 2017
Indicators value changes by year
Minimum:
3.374K
jan 1, 2000
Maximum:
371.347K
jan 1, 2012
At the date of observation
Value
Absolute change
Change from previous value
jan 1, 1972
8.822K
+8.822K
0.0%
jan 1, 1973
8.612K
-210.0
-2.38%
jan 1, 1974
8.494K
-118.0
-1.37%
jan 1, 1975
8.659K
+165.0
1.94%
jan 1, 1985
3.949K
-4.71K
-54.39%
jan 1, 1986
9.618K
+5.669K
143.56%
jan 1, 1987
10.652K
+1.034K
10.75%
jan 1, 1988
9.995K
-657.0
-6.17%
jan 1, 1989
9.5K
-495.0
-4.95%
jan 1, 1990
8.243K
-1.257K
-13.23%
jan 1, 1992
7.17K
-1.073K
-13.02%
jan 1, 1993
7.201K
+31.0
0.43%
jan 1, 1994
8.336K
+1.135K
15.76%
jan 1, 1995
8.387K
+51.0
0.61%
jan 1, 1996
9.103K
+716.0
8.54%
jan 1, 1997
8.638K
-465.0
-5.11%
jan 1, 1999
9.771K
+1.133K
13.12%
jan 1, 2000
3.374K
-6.397K
-65.47%
jan 1, 2001
7.738K
+4.364K
129.34%
jan 1, 2002
8.639K
+901.0
11.64%
jan 1, 2003
38.176K
+29.537K
341.9%
jan 1, 2004
72.162K
+33.986K
89.02%
jan 1, 2005
87.158K
+14.996K
20.78%
jan 1, 2006
106.336K
+19.178K
22.0%
jan 1, 2007
123.557K
+17.221K
16.19%
jan 1, 2008
191.151K
+67.594K
54.71%
jan 1, 2009
229.252K
+38.101K
19.93%
jan 1, 2010
307.674K
+78.422K
34.21%
jan 1, 2011
353.42K
+45.746K
14.87%
jan 1, 2012
371.347K
+17.927K
5.07%
jan 1, 2013
201.142K
-170.205K
-45.83%
Ranking of countries by current statistics by years


Comments: