29
/
en
AIzaSyAYiBZKx7MnpbEhh9jyipgxe19OcubqV5w
April 1, 2024
30094
Euro area
EMU
false
2
1
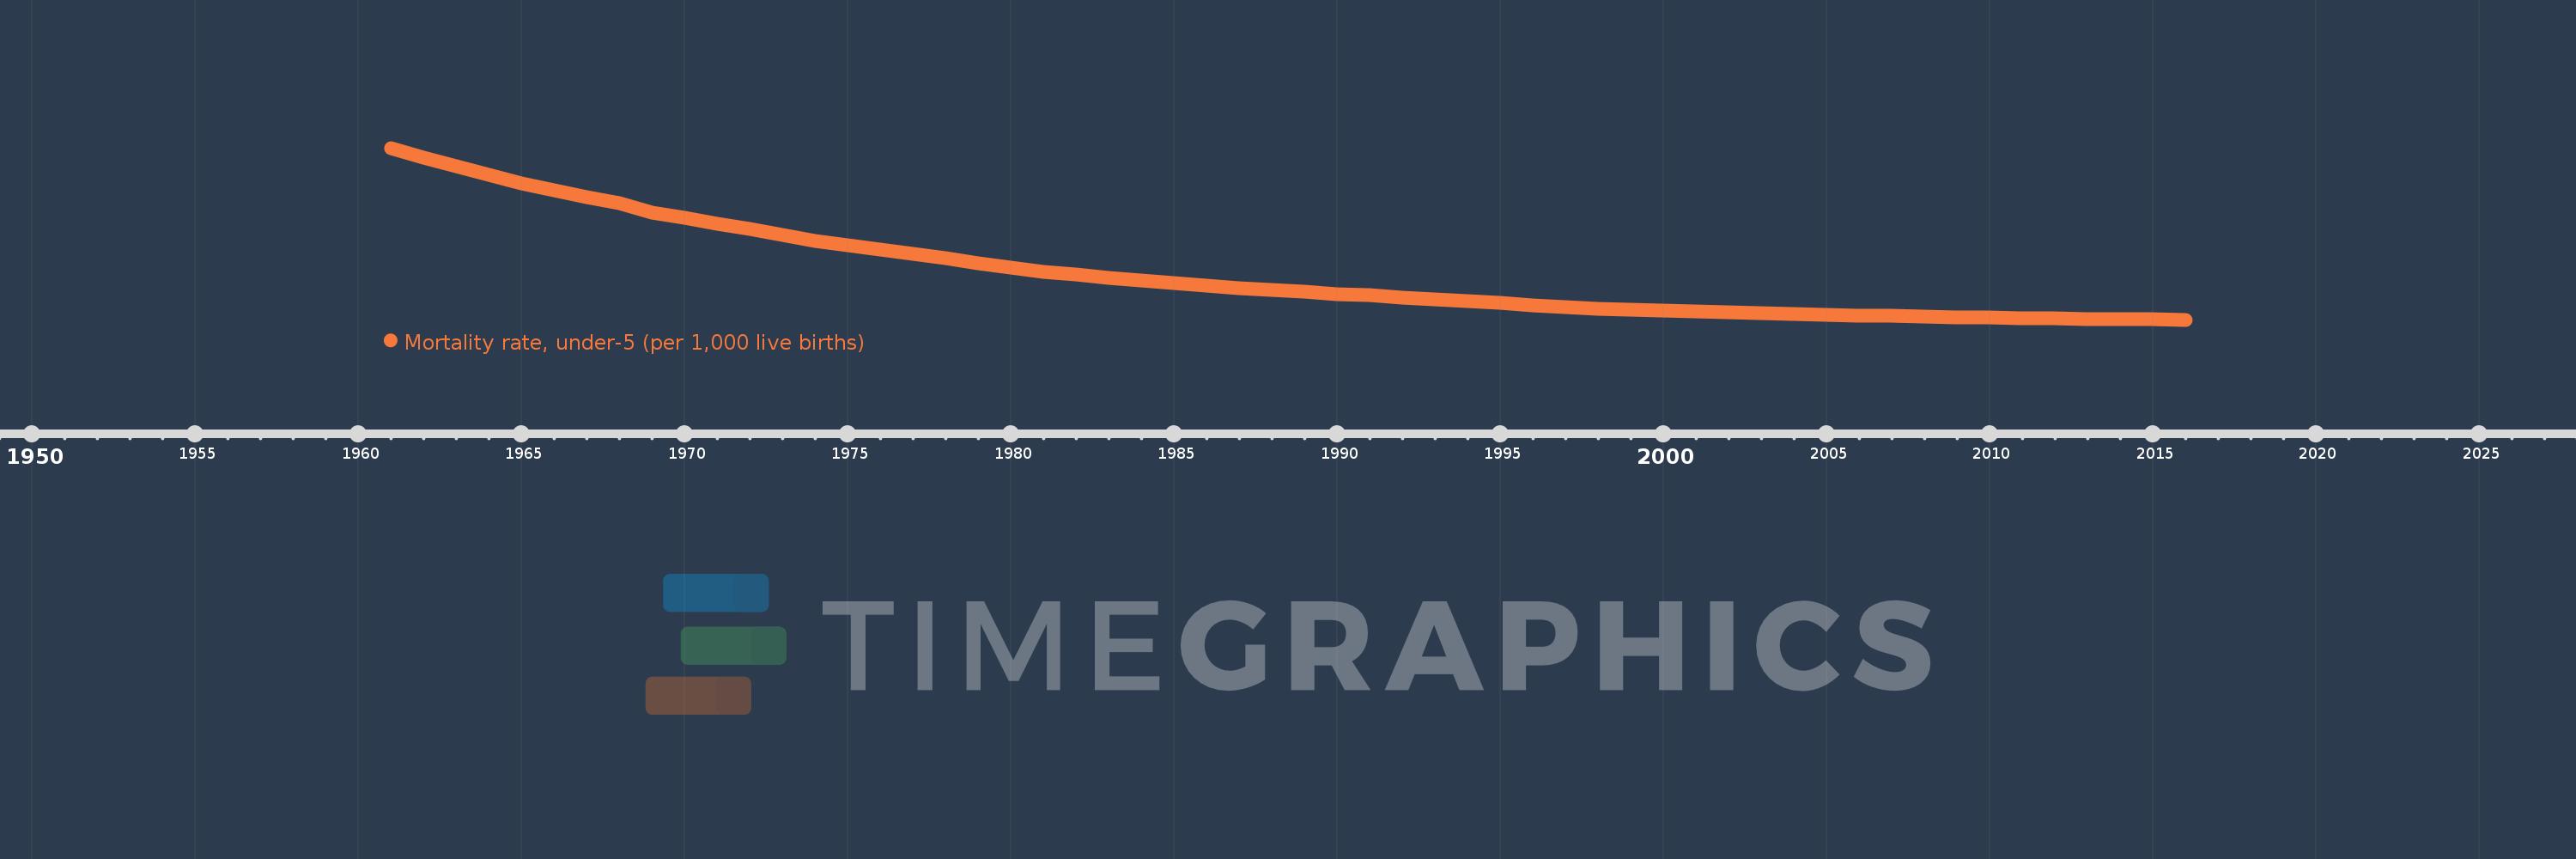
Mortality rate, under-5 (per 1,000 live births)
2016,2015,2014,2013,2012,2011,2010,2009,2008,2007,2006,2005,2004,2003,2002,2001,2000,1999,1998,1997,1996,1995,1994,1993,1992,1991,1990,1989,1988,1987,1986,1985,1984,1983,1982,1981,1980,1979,1978,1977,1976,1975,1974,1973,1972,1971,1970,1969,1968,1967,1966,1965,1964,1963,1962,1961
This statistics in other country:
AfghanistanAlbaniaAlgeriaAndorraAngolaAntigua and BarbudaArab WorldArgentinaArmeniaAustraliaAustriaAzerbaijanBahamas, TheBahrainBangladeshBarbadosBelarusBelgiumBelizeBeninBhutanBoliviaBosnia and HerzegovinaBotswanaBrazilBrunei DarussalamBulgariaBurkina FasoBurundiCabo VerdeCambodiaCameroonCanadaCaribbean small statesCentral African RepublicCentral Europe and the BalticsChadChileChinaColombiaComorosCongo, Dem. Rep.Congo, Rep.Costa RicaCote d'IvoireCroatiaCubaCyprusCzech RepublicDenmarkDjiboutiDominicaDominican RepublicEarly-demographic dividendEast Asia & PacificEast Asia & Pacific (excluding high income)East Asia & Pacific (IDA & IBRD countries)EcuadorEgypt, Arab Rep.El SalvadorEquatorial GuineaEritreaEstoniaEthiopiaEuro areaEurope & Central AsiaEurope & Central Asia (excluding high income)Europe & Central Asia (IDA & IBRD countries)European UnionFijiFinlandFragile and conflict affected situationsFranceGabonGambia, TheGeorgiaGermanyGhanaGreeceGrenadaGuatemalaGuineaGuinea-BissauGuyanaHaitiHeavily indebted poor countries (HIPC)High incomeHondurasHungaryIBRD onlyIcelandIDA & IBRD totalIDA blendIDA onlyIDA totalIndiaIndonesiaIran, Islamic Rep.IraqIrelandIsraelItalyJamaicaJapanJordanKazakhstanKenyaKiribatiKorea, Dem. People’s Rep.Korea, Rep.KuwaitKyrgyz RepublicLao PDRLate-demographic dividendLatin America & Caribbean Latin America & Caribbean (excluding high income)Latin America & the Caribbean (IDA & IBRD countries)LatviaLeast developed countries: UN classificationLebanonLesothoLiberiaLibyaLithuaniaLow & middle incomeLow incomeLower middle incomeLuxembourgMacedonia, FYRMadagascarMalawiMalaysiaMaldivesMaliMaltaMarshall IslandsMauritaniaMauritiusMexicoMicronesia, Fed. Sts.Middle East & North AfricaMiddle East & North Africa (excluding high income)Middle East & North Africa (IDA & IBRD countries)Middle incomeMoldovaMonacoMongoliaMontenegroMoroccoMozambiqueMyanmarNamibiaNauruNepalNetherlandsNew ZealandNicaraguaNigerNigeriaNorth AmericaNorwayOECD membersOmanOther small statesPacific island small statesPakistanPalauPanamaPapua New GuineaParaguayPeruPhilippinesPolandPortugalPost-demographic dividendPre-demographic dividendQatarRomaniaRussian FederationRwandaSamoaSan MarinoSao Tome and PrincipeSaudi ArabiaSenegalSerbiaSeychellesSierra LeoneSingaporeSlovak RepublicSloveniaSmall statesSolomon IslandsSomaliaSouth AfricaSouth AsiaSouth Asia (IDA & IBRD)South SudanSpainSri LankaSt. Kitts and NevisSt. LuciaSt. Vincent and the GrenadinesSub-Saharan Africa Sub-Saharan Africa (excluding high income)Sub-Saharan Africa (IDA & IBRD countries)SudanSurinameSwazilandSwedenSwitzerlandSyrian Arab RepublicTajikistanTanzaniaThailandTimor-LesteTogoTongaTrinidad and TobagoTunisiaTurkeyTurkmenistanTuvaluUgandaUkraineUnited Arab EmiratesUnited KingdomUnited StatesUpper middle incomeUruguayUzbekistanVanuatuVenezuela, RBVietnamWest Bank and GazaWorldYemen, Rep.ZambiaZimbabwe Timeline:
This timeline shows a graph from 1961 to 2016 of Euro area. No data until 1960. Number of actual observations by date: 56.
Source name:
World Development Indicators
Source organization:
Estimates Developed by the UN Inter-agency Group for Child Mortality Estimation (UNICEF, WHO, World Bank, UN DESA Population Division) at www.childmortality.org. Projected data are from the United Nations Population Division's World Population Prospects; and may in some cases not be consistent with data before the current year.
Categories, topics:
Health, Aid Effectiveness, Climate Change
Last updated:
apr 23, 2017
Indicators value changes by year
Maximum:
46.703
jan 1, 1961
At the date of observation
Value
Absolute change
Change from previous value
jan 1, 1961
46.703
+46.703
0.0%
jan 1, 1962
44.37
-2.333
-5.0%
jan 1, 1963
42.1
-2.27
-5.12%
jan 1, 1964
39.949
-2.15
-5.11%
jan 1, 1965
37.904
-2.046
-5.12%
jan 1, 1966
36.087
-1.817
-4.79%
jan 1, 1967
34.496
-1.59
-4.41%
jan 1, 1968
33.026
-1.47
-4.26%
jan 1, 1969
30.516
-2.511
-7.6%
jan 1, 1970
29.243
-1.273
-4.17%
jan 1, 1971
27.89
-1.353
-4.63%
jan 1, 1972
26.448
-1.442
-5.17%
jan 1, 1973
24.977
-1.471
-5.56%
jan 1, 1974
23.634
-1.343
-5.38%
jan 1, 1975
22.493
-1.141
-4.83%
jan 1, 1976
21.484
-1.009
-4.49%
jan 1, 1977
20.399
-1.085
-5.05%
jan 1, 1978
19.224
-1.176
-5.76%
jan 1, 1979
17.987
-1.237
-6.44%
jan 1, 1980
16.917
-1.069
-5.94%
jan 1, 1981
15.964
-0.953
-5.63%
jan 1, 1982
15.312
-0.652
-4.09%
jan 1, 1983
14.475
-0.837
-5.47%
jan 1, 1984
13.768
-0.707
-4.88%
jan 1, 1985
13.075
-0.693
-5.03%
jan 1, 1986
12.422
-0.653
-5.0%
jan 1, 1987
11.849
-0.573
-4.61%
jan 1, 1988
11.34
-0.508
-4.29%
jan 1, 1989
10.866
-0.474
-4.18%
jan 1, 1990
10.418
-0.448
-4.13%
jan 1, 1991
10.004
-0.414
-3.97%
jan 1, 1992
9.557
-0.447
-4.47%
jan 1, 1993
9.129
-0.428
-4.48%
jan 1, 1994
8.644
-0.485
-5.31%
jan 1, 1995
8.102
-0.542
-6.27%
jan 1, 1996
7.603
-0.499
-6.16%
jan 1, 1997
7.151
-0.452
-5.95%
jan 1, 1998
6.78
-0.371
-5.19%
jan 1, 1999
6.486
-0.295
-4.34%
jan 1, 2000
6.238
-0.247
-3.81%
jan 1, 2001
6.022
-0.216
-3.47%
jan 1, 2002
5.805
-0.218
-3.61%
jan 1, 2003
5.608
-0.196
-3.38%
jan 1, 2004
5.401
-0.207
-3.69%
jan 1, 2005
5.205
-0.196
-3.64%
jan 1, 2006
5.03
-0.174
-3.35%
jan 1, 2007
4.88
-0.15
-2.98%
jan 1, 2008
4.722
-0.158
-3.24%
jan 1, 2009
4.584
-0.138
-2.93%
jan 1, 2010
4.492
-0.092
-2.01%
jan 1, 2011
4.382
-0.11
-2.45%
jan 1, 2012
4.294
-0.088
-2.01%
jan 1, 2013
4.21
-0.084
-1.94%
jan 1, 2014
4.153
-0.057
-1.36%
jan 1, 2015
4.069
-0.084
-2.02%
jan 1, 2016
3.965
-0.104
-2.55%
Ranking of countries by current statistics by years


Comments: