29
/
en
AIzaSyAYiBZKx7MnpbEhh9jyipgxe19OcubqV5w
April 1, 2024
39226
IDA only
IDX
false
2
1
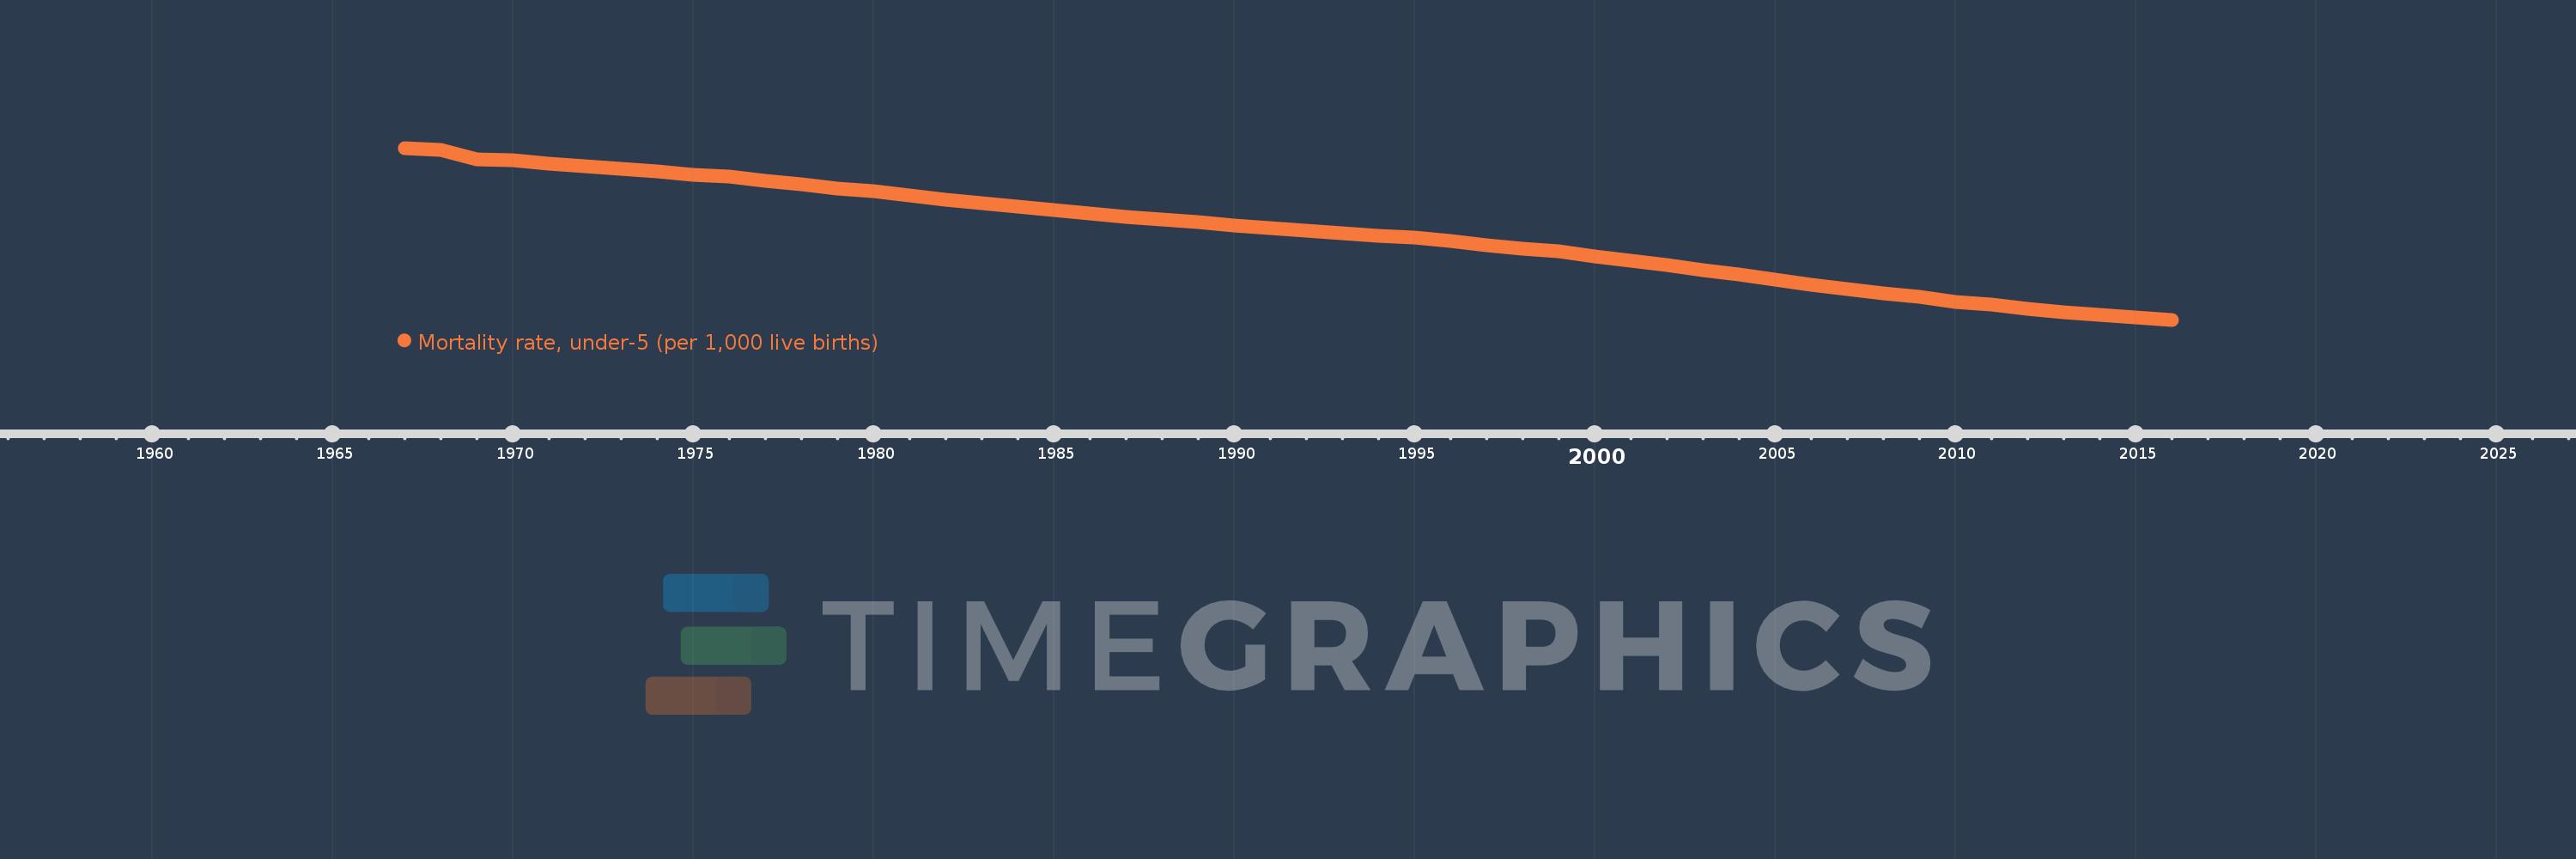
Mortality rate, under-5 (per 1,000 live births)
2016,2015,2014,2013,2012,2011,2010,2009,2008,2007,2006,2005,2004,2003,2002,2001,2000,1999,1998,1997,1996,1995,1994,1993,1992,1991,1990,1989,1988,1987,1986,1985,1984,1983,1982,1981,1980,1979,1978,1977,1976,1975,1974,1973,1972,1971,1970,1969,1968,1967
This statistics in other country:
AfghanistanAlbaniaAlgeriaAndorraAngolaAntigua and BarbudaArab WorldArgentinaArmeniaAustraliaAustriaAzerbaijanBahamas, TheBahrainBangladeshBarbadosBelarusBelgiumBelizeBeninBhutanBoliviaBosnia and HerzegovinaBotswanaBrazilBrunei DarussalamBulgariaBurkina FasoBurundiCabo VerdeCambodiaCameroonCanadaCaribbean small statesCentral African RepublicCentral Europe and the BalticsChadChileChinaColombiaComorosCongo, Dem. Rep.Congo, Rep.Costa RicaCote d'IvoireCroatiaCubaCyprusCzech RepublicDenmarkDjiboutiDominicaDominican RepublicEarly-demographic dividendEast Asia & PacificEast Asia & Pacific (excluding high income)East Asia & Pacific (IDA & IBRD countries)EcuadorEgypt, Arab Rep.El SalvadorEquatorial GuineaEritreaEstoniaEthiopiaEuro areaEurope & Central AsiaEurope & Central Asia (excluding high income)Europe & Central Asia (IDA & IBRD countries)European UnionFijiFinlandFragile and conflict affected situationsFranceGabonGambia, TheGeorgiaGermanyGhanaGreeceGrenadaGuatemalaGuineaGuinea-BissauGuyanaHaitiHeavily indebted poor countries (HIPC)High incomeHondurasHungaryIBRD onlyIcelandIDA & IBRD totalIDA blendIDA onlyIDA totalIndiaIndonesiaIran, Islamic Rep.IraqIrelandIsraelItalyJamaicaJapanJordanKazakhstanKenyaKiribatiKorea, Dem. People’s Rep.Korea, Rep.KuwaitKyrgyz RepublicLao PDRLate-demographic dividendLatin America & Caribbean Latin America & Caribbean (excluding high income)Latin America & the Caribbean (IDA & IBRD countries)LatviaLeast developed countries: UN classificationLebanonLesothoLiberiaLibyaLithuaniaLow & middle incomeLow incomeLower middle incomeLuxembourgMacedonia, FYRMadagascarMalawiMalaysiaMaldivesMaliMaltaMarshall IslandsMauritaniaMauritiusMexicoMicronesia, Fed. Sts.Middle East & North AfricaMiddle East & North Africa (excluding high income)Middle East & North Africa (IDA & IBRD countries)Middle incomeMoldovaMonacoMongoliaMontenegroMoroccoMozambiqueMyanmarNamibiaNauruNepalNetherlandsNew ZealandNicaraguaNigerNigeriaNorth AmericaNorwayOECD membersOmanOther small statesPacific island small statesPakistanPalauPanamaPapua New GuineaParaguayPeruPhilippinesPolandPortugalPost-demographic dividendPre-demographic dividendQatarRomaniaRussian FederationRwandaSamoaSan MarinoSao Tome and PrincipeSaudi ArabiaSenegalSerbiaSeychellesSierra LeoneSingaporeSlovak RepublicSloveniaSmall statesSolomon IslandsSomaliaSouth AfricaSouth AsiaSouth Asia (IDA & IBRD)South SudanSpainSri LankaSt. Kitts and NevisSt. LuciaSt. Vincent and the GrenadinesSub-Saharan Africa Sub-Saharan Africa (excluding high income)Sub-Saharan Africa (IDA & IBRD countries)SudanSurinameSwazilandSwedenSwitzerlandSyrian Arab RepublicTajikistanTanzaniaThailandTimor-LesteTogoTongaTrinidad and TobagoTunisiaTurkeyTurkmenistanTuvaluUgandaUkraineUnited Arab EmiratesUnited KingdomUnited StatesUpper middle incomeUruguayUzbekistanVanuatuVenezuela, RBVietnamWest Bank and GazaWorldYemen, Rep.ZambiaZimbabwe Timeline:
This timeline shows a graph from 1967 to 2016 of IDA only. No data until 1966. Number of actual observations by date: 50.
Source name:
World Development Indicators
Source organization:
Estimates Developed by the UN Inter-agency Group for Child Mortality Estimation (UNICEF, WHO, World Bank, UN DESA Population Division) at www.childmortality.org. Projected data are from the United Nations Population Division's World Population Prospects; and may in some cases not be consistent with data before the current year.
Categories, topics:
Health, Aid Effectiveness, Climate Change
Last updated:
apr 23, 2017
Indicators value changes by year
Minimum:
67.751
jan 1, 2016
Maximum:
248.898
jan 1, 1967
At the date of observation
Value
Absolute change
Change from previous value
jan 1, 1967
248.898
+248.898
0.0%
jan 1, 1968
246.851
-2.047
-0.82%
jan 1, 1969
237.192
-9.66
-3.91%
jan 1, 1970
235.504
-1.687
-0.71%
jan 1, 1971
232.731
-2.773
-1.18%
jan 1, 1972
230.004
-2.727
-1.17%
jan 1, 1973
226.885
-3.118
-1.36%
jan 1, 1974
223.928
-2.958
-1.3%
jan 1, 1975
220.759
-3.169
-1.42%
jan 1, 1976
218.447
-2.312
-1.05%
jan 1, 1977
214.579
-3.867
-1.77%
jan 1, 1978
210.525
-4.055
-1.89%
jan 1, 1979
206.332
-4.193
-1.99%
jan 1, 1980
203.139
-3.192
-1.55%
jan 1, 1981
198.869
-4.271
-2.1%
jan 1, 1982
194.679
-4.19
-2.11%
jan 1, 1983
190.614
-4.065
-2.09%
jan 1, 1984
186.786
-3.828
-2.01%
jan 1, 1985
183.109
-3.677
-1.97%
jan 1, 1986
179.734
-3.375
-1.84%
jan 1, 1987
176.606
-3.128
-1.74%
jan 1, 1988
173.443
-3.163
-1.79%
jan 1, 1989
170.381
-3.061
-1.76%
jan 1, 1990
167.39
-2.991
-1.76%
jan 1, 1991
164.508
-2.882
-1.72%
jan 1, 1992
161.644
-2.864
-1.74%
jan 1, 1993
158.765
-2.88
-1.78%
jan 1, 1994
155.953
-2.812
-1.77%
jan 1, 1995
154.055
-1.898
-1.22%
jan 1, 1996
150.418
-3.636
-2.36%
jan 1, 1997
146.309
-4.109
-2.73%
jan 1, 1998
142.992
-3.317
-2.27%
jan 1, 1999
139.489
-3.503
-2.45%
jan 1, 2000
134.903
-4.586
-3.29%
jan 1, 2001
130.328
-4.575
-3.39%
jan 1, 2002
125.453
-4.875
-3.74%
jan 1, 2003
120.295
-5.158
-4.11%
jan 1, 2004
115.062
-5.233
-4.35%
jan 1, 2005
109.859
-5.203
-4.52%
jan 1, 2006
104.807
-5.052
-4.6%
jan 1, 2007
99.958
-4.849
-4.63%
jan 1, 2008
95.26
-4.699
-4.7%
jan 1, 2009
91.542
-3.717
-3.9%
jan 1, 2010
86.573
-4.969
-5.43%
jan 1, 2011
83.838
-2.735
-3.16%
jan 1, 2012
79.164
-4.674
-5.58%
jan 1, 2013
75.812
-3.351
-4.23%
jan 1, 2014
72.844
-2.968
-3.92%
jan 1, 2015
70.135
-2.71
-3.72%
jan 1, 2016
67.751
-2.384
-3.4%
Ranking of countries by current statistics by years


Comments: