29
/
en
AIzaSyAYiBZKx7MnpbEhh9jyipgxe19OcubqV5w
April 1, 2024
50247
Middle East & North Africa (IDA & IBRD countries)
TMN
false
2
1
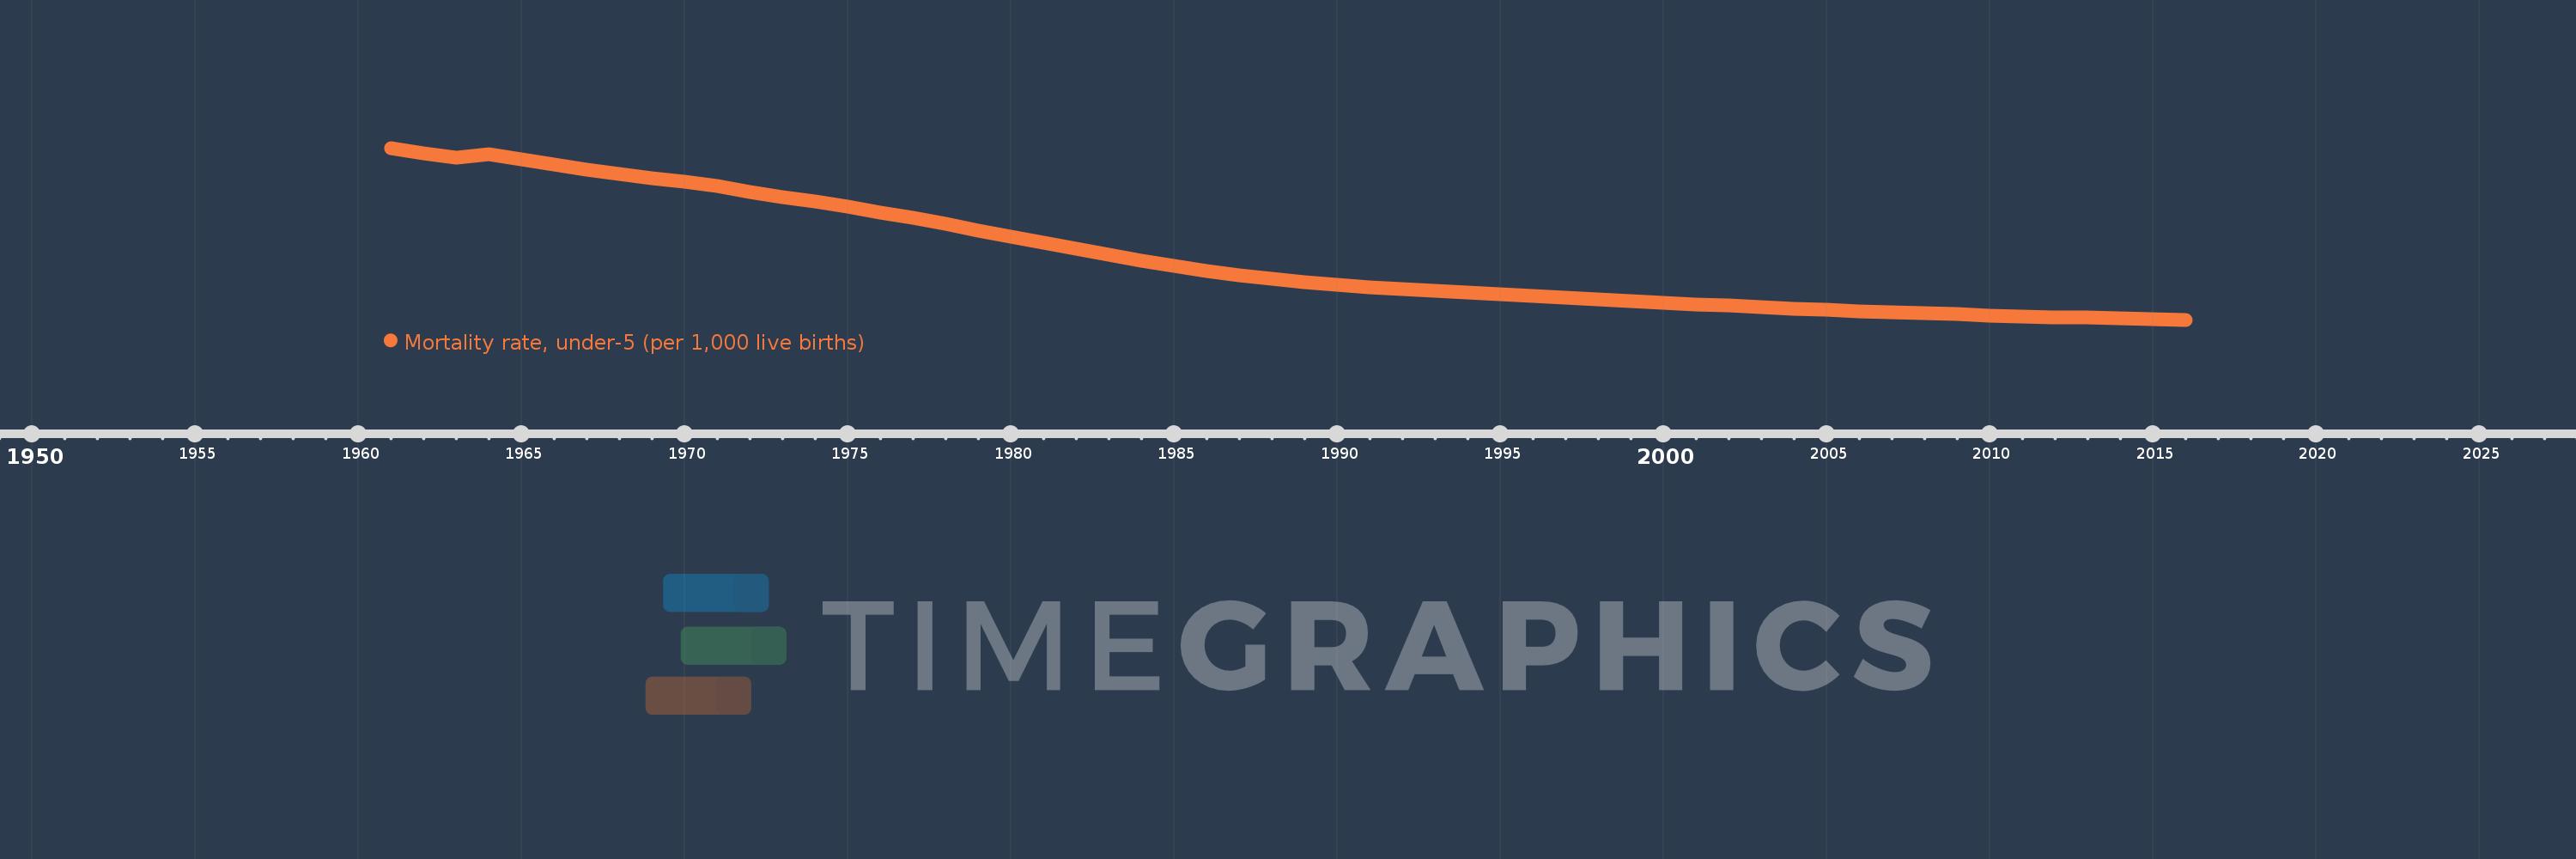
Mortality rate, under-5 (per 1,000 live births)
2016,2015,2014,2013,2012,2011,2010,2009,2008,2007,2006,2005,2004,2003,2002,2001,2000,1999,1998,1997,1996,1995,1994,1993,1992,1991,1990,1989,1988,1987,1986,1985,1984,1983,1982,1981,1980,1979,1978,1977,1976,1975,1974,1973,1972,1971,1970,1969,1968,1967,1966,1965,1964,1963,1962,1961
This statistics in other country:
AfghanistanAlbaniaAlgeriaAndorraAngolaAntigua and BarbudaArab WorldArgentinaArmeniaAustraliaAustriaAzerbaijanBahamas, TheBahrainBangladeshBarbadosBelarusBelgiumBelizeBeninBhutanBoliviaBosnia and HerzegovinaBotswanaBrazilBrunei DarussalamBulgariaBurkina FasoBurundiCabo VerdeCambodiaCameroonCanadaCaribbean small statesCentral African RepublicCentral Europe and the BalticsChadChileChinaColombiaComorosCongo, Dem. Rep.Congo, Rep.Costa RicaCote d'IvoireCroatiaCubaCyprusCzech RepublicDenmarkDjiboutiDominicaDominican RepublicEarly-demographic dividendEast Asia & PacificEast Asia & Pacific (excluding high income)East Asia & Pacific (IDA & IBRD countries)EcuadorEgypt, Arab Rep.El SalvadorEquatorial GuineaEritreaEstoniaEthiopiaEuro areaEurope & Central AsiaEurope & Central Asia (excluding high income)Europe & Central Asia (IDA & IBRD countries)European UnionFijiFinlandFragile and conflict affected situationsFranceGabonGambia, TheGeorgiaGermanyGhanaGreeceGrenadaGuatemalaGuineaGuinea-BissauGuyanaHaitiHeavily indebted poor countries (HIPC)High incomeHondurasHungaryIBRD onlyIcelandIDA & IBRD totalIDA blendIDA onlyIDA totalIndiaIndonesiaIran, Islamic Rep.IraqIrelandIsraelItalyJamaicaJapanJordanKazakhstanKenyaKiribatiKorea, Dem. People’s Rep.Korea, Rep.KuwaitKyrgyz RepublicLao PDRLate-demographic dividendLatin America & Caribbean Latin America & Caribbean (excluding high income)Latin America & the Caribbean (IDA & IBRD countries)LatviaLeast developed countries: UN classificationLebanonLesothoLiberiaLibyaLithuaniaLow & middle incomeLow incomeLower middle incomeLuxembourgMacedonia, FYRMadagascarMalawiMalaysiaMaldivesMaliMaltaMarshall IslandsMauritaniaMauritiusMexicoMicronesia, Fed. Sts.Middle East & North AfricaMiddle East & North Africa (excluding high income)Middle East & North Africa (IDA & IBRD countries)Middle incomeMoldovaMonacoMongoliaMontenegroMoroccoMozambiqueMyanmarNamibiaNauruNepalNetherlandsNew ZealandNicaraguaNigerNigeriaNorth AmericaNorwayOECD membersOmanOther small statesPacific island small statesPakistanPalauPanamaPapua New GuineaParaguayPeruPhilippinesPolandPortugalPost-demographic dividendPre-demographic dividendQatarRomaniaRussian FederationRwandaSamoaSan MarinoSao Tome and PrincipeSaudi ArabiaSenegalSerbiaSeychellesSierra LeoneSingaporeSlovak RepublicSloveniaSmall statesSolomon IslandsSomaliaSouth AfricaSouth AsiaSouth Asia (IDA & IBRD)South SudanSpainSri LankaSt. Kitts and NevisSt. LuciaSt. Vincent and the GrenadinesSub-Saharan Africa Sub-Saharan Africa (excluding high income)Sub-Saharan Africa (IDA & IBRD countries)SudanSurinameSwazilandSwedenSwitzerlandSyrian Arab RepublicTajikistanTanzaniaThailandTimor-LesteTogoTongaTrinidad and TobagoTunisiaTurkeyTurkmenistanTuvaluUgandaUkraineUnited Arab EmiratesUnited KingdomUnited StatesUpper middle incomeUruguayUzbekistanVanuatuVenezuela, RBVietnamWest Bank and GazaWorldYemen, Rep.ZambiaZimbabwe Timeline:
This timeline shows a graph from 1961 to 2016 of Middle East & North Africa (IDA & IBRD countries). No data until 1960. Number of actual observations by date: 56.
Source name:
World Development Indicators
Source organization:
Estimates Developed by the UN Inter-agency Group for Child Mortality Estimation (UNICEF, WHO, World Bank, UN DESA Population Division) at www.childmortality.org. Projected data are from the United Nations Population Division's World Population Prospects; and may in some cases not be consistent with data before the current year.
Categories, topics:
Health, Aid Effectiveness, Climate Change
Last updated:
apr 23, 2017
Indicators value changes by year
Minimum:
24.905
jan 1, 2016
Maximum:
257.684
jan 1, 1961
At the date of observation
Value
Absolute change
Change from previous value
jan 1, 1961
257.684
+257.684
0.0%
jan 1, 1962
250.008
-7.676
-2.98%
jan 1, 1963
243.992
-6.016
-2.41%
jan 1, 1964
248.788
+4.797
1.97%
jan 1, 1965
241.766
-7.022
-2.82%
jan 1, 1966
235.097
-6.669
-2.76%
jan 1, 1967
228.812
-6.284
-2.67%
jan 1, 1968
222.81
-6.002
-2.62%
jan 1, 1969
217.061
-5.749
-2.58%
jan 1, 1970
211.529
-5.531
-2.55%
jan 1, 1971
206.12
-5.41
-2.56%
jan 1, 1972
197.587
-8.533
-4.14%
jan 1, 1973
191.311
-6.276
-3.18%
jan 1, 1974
184.77
-6.54
-3.42%
jan 1, 1975
177.793
-6.977
-3.78%
jan 1, 1976
170.33
-7.464
-4.2%
jan 1, 1977
162.533
-7.797
-4.58%
jan 1, 1978
154.417
-8.116
-4.99%
jan 1, 1979
146.108
-8.308
-5.38%
jan 1, 1980
137.759
-8.349
-5.71%
jan 1, 1981
129.372
-8.388
-6.09%
jan 1, 1982
121.01
-8.362
-6.46%
jan 1, 1983
112.755
-8.255
-6.82%
jan 1, 1984
104.867
-7.888
-7.0%
jan 1, 1985
97.431
-7.436
-7.09%
jan 1, 1986
90.72
-6.711
-6.89%
jan 1, 1987
84.931
-5.789
-6.38%
jan 1, 1988
79.972
-4.959
-5.84%
jan 1, 1989
75.761
-4.211
-5.27%
jan 1, 1990
72.221
-3.54
-4.67%
jan 1, 1991
69.177
-3.044
-4.21%
jan 1, 1992
66.493
-2.684
-3.88%
jan 1, 1993
63.978
-2.515
-3.78%
jan 1, 1994
61.605
-2.373
-3.71%
jan 1, 1995
59.22
-2.385
-3.87%
jan 1, 1996
56.93
-2.291
-3.87%
jan 1, 1997
54.652
-2.278
-4.0%
jan 1, 1998
52.465
-2.187
-4.0%
jan 1, 1999
50.252
-2.212
-4.22%
jan 1, 2000
48.141
-2.111
-4.2%
jan 1, 2001
46.061
-2.08
-4.32%
jan 1, 2002
44.027
-2.033
-4.41%
jan 1, 2003
42.072
-1.956
-4.44%
jan 1, 2004
40.2
-1.872
-4.45%
jan 1, 2005
38.413
-1.786
-4.44%
jan 1, 2006
36.721
-1.693
-4.41%
jan 1, 2007
35.109
-1.611
-4.39%
jan 1, 2008
33.595
-1.515
-4.31%
jan 1, 2009
32.128
-1.467
-4.37%
jan 1, 2010
30.815
-1.313
-4.09%
jan 1, 2011
29.543
-1.272
-4.13%
jan 1, 2012
28.464
-1.079
-3.65%
jan 1, 2013
27.495
-0.969
-3.4%
jan 1, 2014
26.586
-0.909
-3.3%
jan 1, 2015
25.684
-0.902
-3.39%
jan 1, 2016
24.905
-0.78
-3.04%
Ranking of countries by current statistics by years


Comments: