29
/
en
AIzaSyAYiBZKx7MnpbEhh9jyipgxe19OcubqV5w
April 1, 2024
43674
Latin America & the Caribbean (IDA & IBRD countries)
TLA
false
2
1
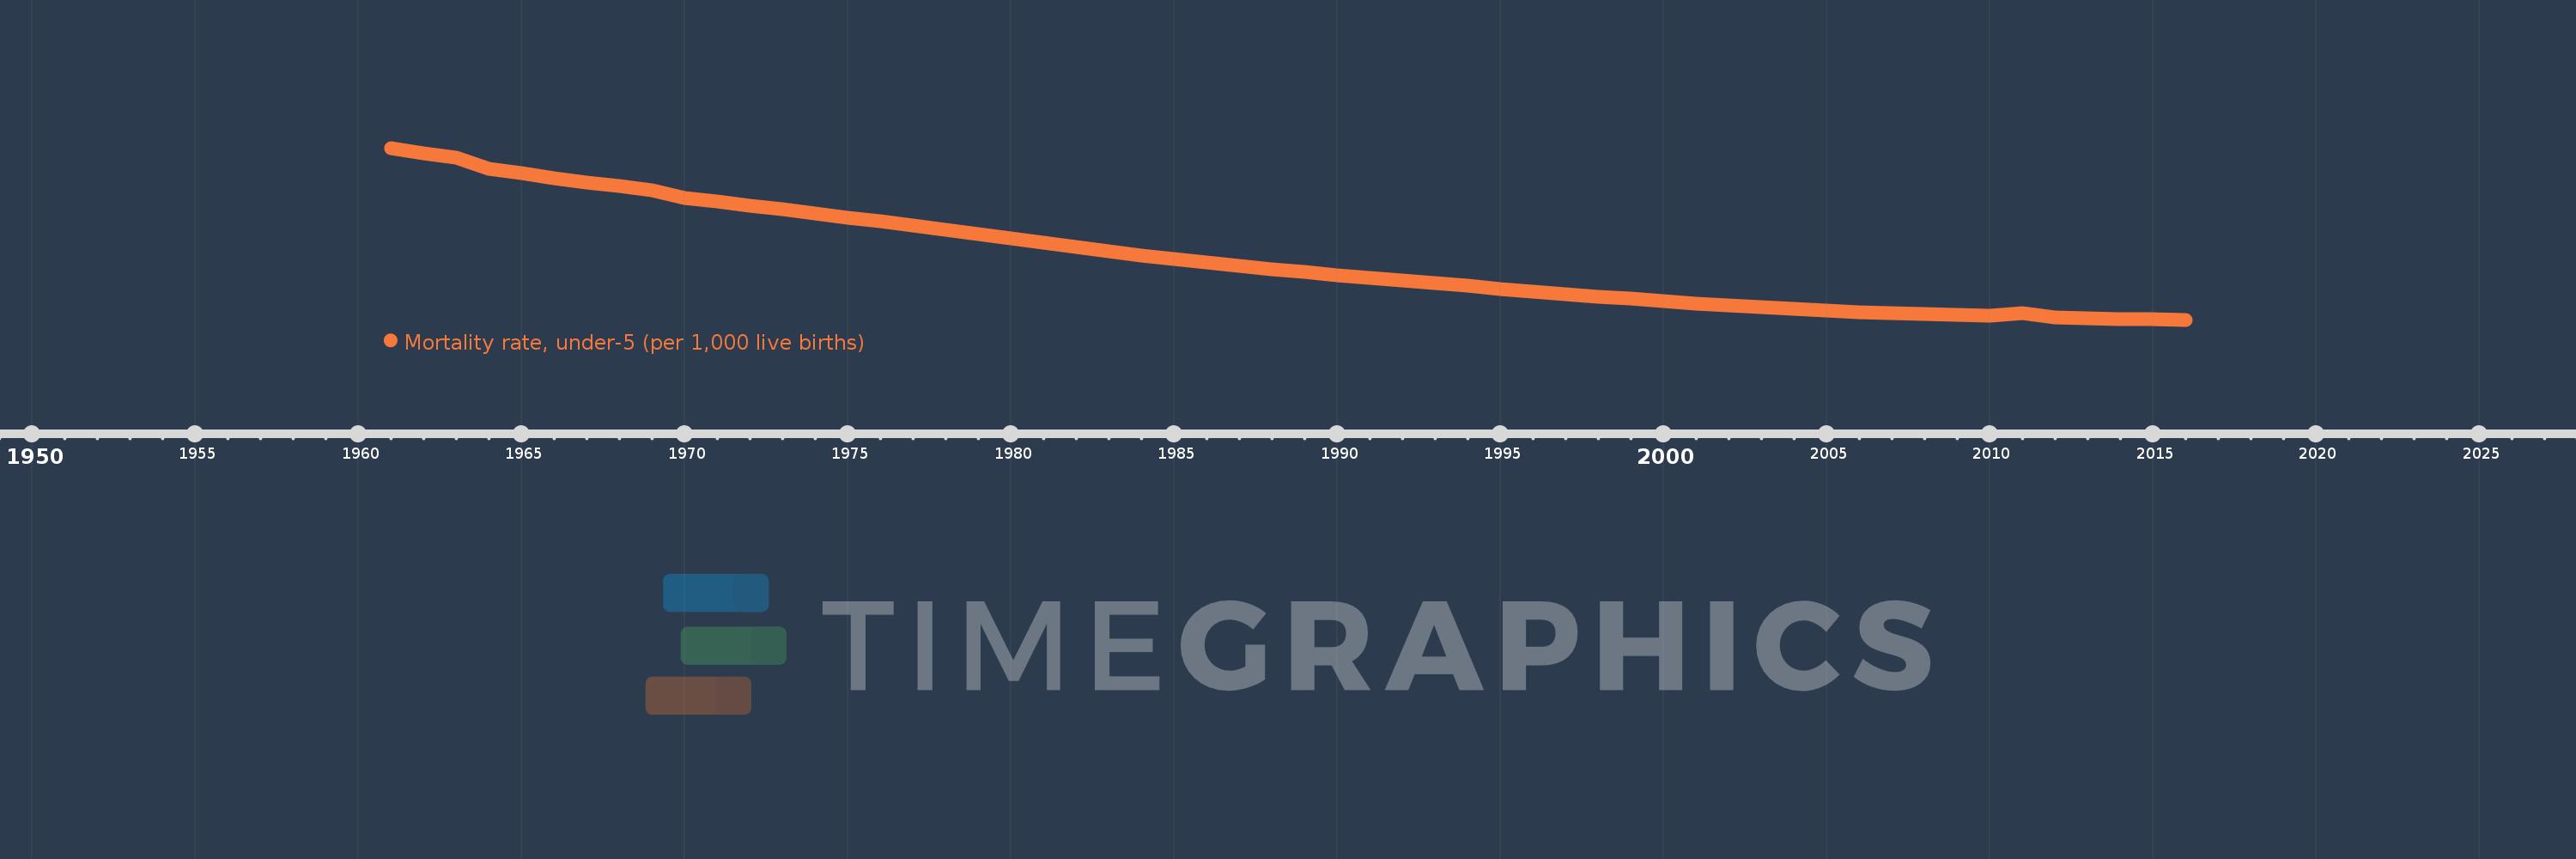
Mortality rate, under-5 (per 1,000 live births)
2016,2015,2014,2013,2012,2011,2010,2009,2008,2007,2006,2005,2004,2003,2002,2001,2000,1999,1998,1997,1996,1995,1994,1993,1992,1991,1990,1989,1988,1987,1986,1985,1984,1983,1982,1981,1980,1979,1978,1977,1976,1975,1974,1973,1972,1971,1970,1969,1968,1967,1966,1965,1964,1963,1962,1961
This statistics in other country:
AfghanistanAlbaniaAlgeriaAndorraAngolaAntigua and BarbudaArab WorldArgentinaArmeniaAustraliaAustriaAzerbaijanBahamas, TheBahrainBangladeshBarbadosBelarusBelgiumBelizeBeninBhutanBoliviaBosnia and HerzegovinaBotswanaBrazilBrunei DarussalamBulgariaBurkina FasoBurundiCabo VerdeCambodiaCameroonCanadaCaribbean small statesCentral African RepublicCentral Europe and the BalticsChadChileChinaColombiaComorosCongo, Dem. Rep.Congo, Rep.Costa RicaCote d'IvoireCroatiaCubaCyprusCzech RepublicDenmarkDjiboutiDominicaDominican RepublicEarly-demographic dividendEast Asia & PacificEast Asia & Pacific (excluding high income)East Asia & Pacific (IDA & IBRD countries)EcuadorEgypt, Arab Rep.El SalvadorEquatorial GuineaEritreaEstoniaEthiopiaEuro areaEurope & Central AsiaEurope & Central Asia (excluding high income)Europe & Central Asia (IDA & IBRD countries)European UnionFijiFinlandFragile and conflict affected situationsFranceGabonGambia, TheGeorgiaGermanyGhanaGreeceGrenadaGuatemalaGuineaGuinea-BissauGuyanaHaitiHeavily indebted poor countries (HIPC)High incomeHondurasHungaryIBRD onlyIcelandIDA & IBRD totalIDA blendIDA onlyIDA totalIndiaIndonesiaIran, Islamic Rep.IraqIrelandIsraelItalyJamaicaJapanJordanKazakhstanKenyaKiribatiKorea, Dem. People’s Rep.Korea, Rep.KuwaitKyrgyz RepublicLao PDRLate-demographic dividendLatin America & Caribbean Latin America & Caribbean (excluding high income)Latin America & the Caribbean (IDA & IBRD countries)LatviaLeast developed countries: UN classificationLebanonLesothoLiberiaLibyaLithuaniaLow & middle incomeLow incomeLower middle incomeLuxembourgMacedonia, FYRMadagascarMalawiMalaysiaMaldivesMaliMaltaMarshall IslandsMauritaniaMauritiusMexicoMicronesia, Fed. Sts.Middle East & North AfricaMiddle East & North Africa (excluding high income)Middle East & North Africa (IDA & IBRD countries)Middle incomeMoldovaMonacoMongoliaMontenegroMoroccoMozambiqueMyanmarNamibiaNauruNepalNetherlandsNew ZealandNicaraguaNigerNigeriaNorth AmericaNorwayOECD membersOmanOther small statesPacific island small statesPakistanPalauPanamaPapua New GuineaParaguayPeruPhilippinesPolandPortugalPost-demographic dividendPre-demographic dividendQatarRomaniaRussian FederationRwandaSamoaSan MarinoSao Tome and PrincipeSaudi ArabiaSenegalSerbiaSeychellesSierra LeoneSingaporeSlovak RepublicSloveniaSmall statesSolomon IslandsSomaliaSouth AfricaSouth AsiaSouth Asia (IDA & IBRD)South SudanSpainSri LankaSt. Kitts and NevisSt. LuciaSt. Vincent and the GrenadinesSub-Saharan Africa Sub-Saharan Africa (excluding high income)Sub-Saharan Africa (IDA & IBRD countries)SudanSurinameSwazilandSwedenSwitzerlandSyrian Arab RepublicTajikistanTanzaniaThailandTimor-LesteTogoTongaTrinidad and TobagoTunisiaTurkeyTurkmenistanTuvaluUgandaUkraineUnited Arab EmiratesUnited KingdomUnited StatesUpper middle incomeUruguayUzbekistanVanuatuVenezuela, RBVietnamWest Bank and GazaWorldYemen, Rep.ZambiaZimbabwe Timeline:
This timeline shows a graph from 1961 to 2016 of Latin America & the Caribbean (IDA & IBRD countries). No data until 1960. Number of actual observations by date: 56.
Source name:
World Development Indicators
Source organization:
Estimates Developed by the UN Inter-agency Group for Child Mortality Estimation (UNICEF, WHO, World Bank, UN DESA Population Division) at www.childmortality.org. Projected data are from the United Nations Population Division's World Population Prospects; and may in some cases not be consistent with data before the current year.
Categories, topics:
Health, Aid Effectiveness, Climate Change
Last updated:
apr 23, 2017
Indicators value changes by year
Minimum:
18.103
jan 1, 2016
Maximum:
169.005
jan 1, 1961
At the date of observation
Value
Absolute change
Change from previous value
jan 1, 1961
169.005
+169.005
0.0%
jan 1, 1962
164.413
-4.592
-2.72%
jan 1, 1963
160.104
-4.31
-2.62%
jan 1, 1964
150.358
-9.745
-6.09%
jan 1, 1965
146.631
-3.727
-2.48%
jan 1, 1966
142.468
-4.163
-2.84%
jan 1, 1967
138.844
-3.624
-2.54%
jan 1, 1968
135.301
-3.544
-2.55%
jan 1, 1969
131.748
-3.553
-2.63%
jan 1, 1970
125.289
-6.458
-4.9%
jan 1, 1971
121.904
-3.386
-2.7%
jan 1, 1972
118.446
-3.458
-2.84%
jan 1, 1973
114.931
-3.514
-2.97%
jan 1, 1974
111.474
-3.458
-3.01%
jan 1, 1975
107.977
-3.497
-3.14%
jan 1, 1976
104.442
-3.535
-3.27%
jan 1, 1977
100.853
-3.589
-3.44%
jan 1, 1978
97.14
-3.713
-3.68%
jan 1, 1979
93.396
-3.744
-3.85%
jan 1, 1980
89.531
-3.865
-4.14%
jan 1, 1981
85.697
-3.834
-4.28%
jan 1, 1982
81.862
-3.835
-4.47%
jan 1, 1983
78.152
-3.711
-4.53%
jan 1, 1984
74.624
-3.528
-4.51%
jan 1, 1985
71.323
-3.301
-4.42%
jan 1, 1986
68.22
-3.103
-4.35%
jan 1, 1987
65.294
-2.926
-4.29%
jan 1, 1988
62.49
-2.804
-4.29%
jan 1, 1989
59.859
-2.631
-4.21%
jan 1, 1990
57.352
-2.506
-4.19%
jan 1, 1991
54.906
-2.446
-4.27%
jan 1, 1992
52.496
-2.41
-4.39%
jan 1, 1993
50.096
-2.4
-4.57%
jan 1, 1994
47.718
-2.379
-4.75%
jan 1, 1995
45.336
-2.382
-4.99%
jan 1, 1996
42.989
-2.347
-5.18%
jan 1, 1997
40.692
-2.297
-5.34%
jan 1, 1998
38.458
-2.234
-5.49%
jan 1, 1999
36.665
-1.793
-4.66%
jan 1, 2000
34.5
-2.166
-5.91%
jan 1, 2001
32.338
-2.162
-6.27%
jan 1, 2002
30.579
-1.759
-5.44%
jan 1, 2003
28.938
-1.641
-5.37%
jan 1, 2004
27.475
-1.462
-5.05%
jan 1, 2005
26.156
-1.32
-4.8%
jan 1, 2006
24.919
-1.237
-4.73%
jan 1, 2007
23.867
-1.051
-4.22%
jan 1, 2008
22.955
-0.912
-3.82%
jan 1, 2009
22.114
-0.841
-3.67%
jan 1, 2010
21.355
-0.759
-3.43%
jan 1, 2011
23.872
+2.518
11.79%
jan 1, 2012
20.028
-3.844
-16.1%
jan 1, 2013
19.456
-0.572
-2.85%
jan 1, 2014
18.928
-0.528
-2.72%
jan 1, 2015
18.497
-0.431
-2.28%
jan 1, 2016
18.103
-0.393
-2.13%
Ranking of countries by current statistics by years


Comments: