29
/
en
AIzaSyAYiBZKx7MnpbEhh9jyipgxe19OcubqV5w
April 1, 2024
40130
IDA total
IDA
false
2
1
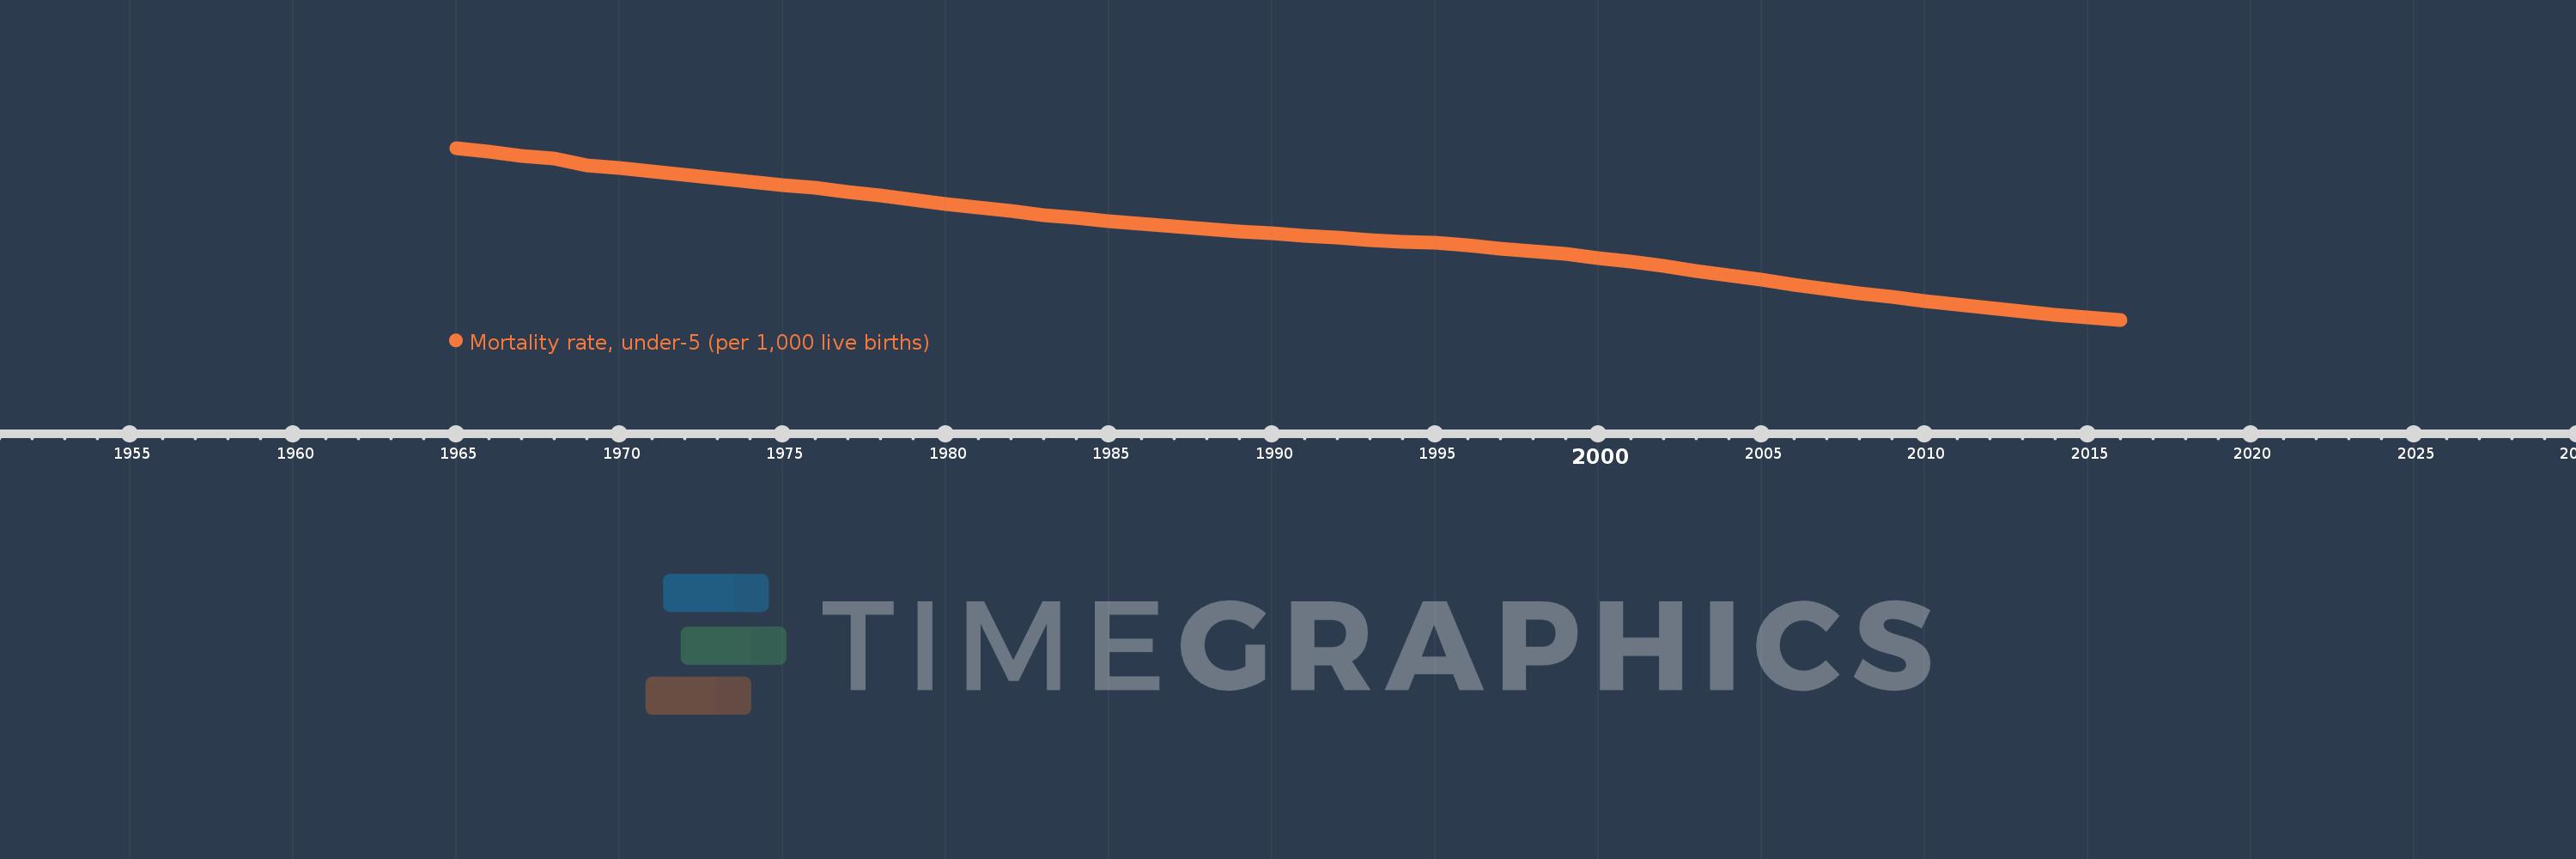
Mortality rate, under-5 (per 1,000 live births)
2016,2015,2014,2013,2012,2011,2010,2009,2008,2007,2006,2005,2004,2003,2002,2001,2000,1999,1998,1997,1996,1995,1994,1993,1992,1991,1990,1989,1988,1987,1986,1985,1984,1983,1982,1981,1980,1979,1978,1977,1976,1975,1974,1973,1972,1971,1970,1969,1968,1967,1966,1965
This statistics in other country:
AfghanistanAlbaniaAlgeriaAndorraAngolaAntigua and BarbudaArab WorldArgentinaArmeniaAustraliaAustriaAzerbaijanBahamas, TheBahrainBangladeshBarbadosBelarusBelgiumBelizeBeninBhutanBoliviaBosnia and HerzegovinaBotswanaBrazilBrunei DarussalamBulgariaBurkina FasoBurundiCabo VerdeCambodiaCameroonCanadaCaribbean small statesCentral African RepublicCentral Europe and the BalticsChadChileChinaColombiaComorosCongo, Dem. Rep.Congo, Rep.Costa RicaCote d'IvoireCroatiaCubaCyprusCzech RepublicDenmarkDjiboutiDominicaDominican RepublicEarly-demographic dividendEast Asia & PacificEast Asia & Pacific (excluding high income)East Asia & Pacific (IDA & IBRD countries)EcuadorEgypt, Arab Rep.El SalvadorEquatorial GuineaEritreaEstoniaEthiopiaEuro areaEurope & Central AsiaEurope & Central Asia (excluding high income)Europe & Central Asia (IDA & IBRD countries)European UnionFijiFinlandFragile and conflict affected situationsFranceGabonGambia, TheGeorgiaGermanyGhanaGreeceGrenadaGuatemalaGuineaGuinea-BissauGuyanaHaitiHeavily indebted poor countries (HIPC)High incomeHondurasHungaryIBRD onlyIcelandIDA & IBRD totalIDA blendIDA onlyIDA totalIndiaIndonesiaIran, Islamic Rep.IraqIrelandIsraelItalyJamaicaJapanJordanKazakhstanKenyaKiribatiKorea, Dem. People’s Rep.Korea, Rep.KuwaitKyrgyz RepublicLao PDRLate-demographic dividendLatin America & Caribbean Latin America & Caribbean (excluding high income)Latin America & the Caribbean (IDA & IBRD countries)LatviaLeast developed countries: UN classificationLebanonLesothoLiberiaLibyaLithuaniaLow & middle incomeLow incomeLower middle incomeLuxembourgMacedonia, FYRMadagascarMalawiMalaysiaMaldivesMaliMaltaMarshall IslandsMauritaniaMauritiusMexicoMicronesia, Fed. Sts.Middle East & North AfricaMiddle East & North Africa (excluding high income)Middle East & North Africa (IDA & IBRD countries)Middle incomeMoldovaMonacoMongoliaMontenegroMoroccoMozambiqueMyanmarNamibiaNauruNepalNetherlandsNew ZealandNicaraguaNigerNigeriaNorth AmericaNorwayOECD membersOmanOther small statesPacific island small statesPakistanPalauPanamaPapua New GuineaParaguayPeruPhilippinesPolandPortugalPost-demographic dividendPre-demographic dividendQatarRomaniaRussian FederationRwandaSamoaSan MarinoSao Tome and PrincipeSaudi ArabiaSenegalSerbiaSeychellesSierra LeoneSingaporeSlovak RepublicSloveniaSmall statesSolomon IslandsSomaliaSouth AfricaSouth AsiaSouth Asia (IDA & IBRD)South SudanSpainSri LankaSt. Kitts and NevisSt. LuciaSt. Vincent and the GrenadinesSub-Saharan Africa Sub-Saharan Africa (excluding high income)Sub-Saharan Africa (IDA & IBRD countries)SudanSurinameSwazilandSwedenSwitzerlandSyrian Arab RepublicTajikistanTanzaniaThailandTimor-LesteTogoTongaTrinidad and TobagoTunisiaTurkeyTurkmenistanTuvaluUgandaUkraineUnited Arab EmiratesUnited KingdomUnited StatesUpper middle incomeUruguayUzbekistanVanuatuVenezuela, RBVietnamWest Bank and GazaWorldYemen, Rep.ZambiaZimbabwe Timeline:
This timeline shows a graph from 1965 to 2016 of IDA total. No data until 1964. Number of actual observations by date: 52.
Source name:
World Development Indicators
Source organization:
Estimates Developed by the UN Inter-agency Group for Child Mortality Estimation (UNICEF, WHO, World Bank, UN DESA Population Division) at www.childmortality.org. Projected data are from the United Nations Population Division's World Population Prospects; and may in some cases not be consistent with data before the current year.
Categories, topics:
Health, Aid Effectiveness, Climate Change
Last updated:
apr 23, 2017
Indicators value changes by year
Minimum:
72.659
jan 1, 2016
Maximum:
241.831
jan 1, 1965
At the date of observation
Value
Absolute change
Change from previous value
jan 1, 1965
241.831
+241.831
0.0%
jan 1, 1966
237.96
-3.871
-1.6%
jan 1, 1967
234.074
-3.886
-1.63%
jan 1, 1968
231.165
-2.909
-1.24%
jan 1, 1969
224.349
-6.816
-2.95%
jan 1, 1970
222.135
-2.214
-0.99%
jan 1, 1971
218.741
-3.394
-1.53%
jan 1, 1972
215.002
-3.739
-1.71%
jan 1, 1973
211.692
-3.309
-1.54%
jan 1, 1974
208.331
-3.361
-1.59%
jan 1, 1975
204.965
-3.366
-1.62%
jan 1, 1976
202.408
-2.557
-1.25%
jan 1, 1977
198.662
-3.746
-1.85%
jan 1, 1978
194.836
-3.826
-1.93%
jan 1, 1979
191.055
-3.782
-1.94%
jan 1, 1980
186.968
-4.087
-2.14%
jan 1, 1981
183.126
-3.842
-2.06%
jan 1, 1982
179.452
-3.674
-2.01%
jan 1, 1983
175.965
-3.487
-1.94%
jan 1, 1984
172.864
-3.101
-1.76%
jan 1, 1985
169.802
-3.063
-1.77%
jan 1, 1986
167.058
-2.743
-1.62%
jan 1, 1987
164.612
-2.447
-1.46%
jan 1, 1988
162.13
-2.482
-1.51%
jan 1, 1989
159.764
-2.366
-1.46%
jan 1, 1990
157.519
-2.245
-1.41%
jan 1, 1991
155.409
-2.11
-1.34%
jan 1, 1992
153.389
-2.02
-1.3%
jan 1, 1993
151.44
-1.949
-1.27%
jan 1, 1994
149.571
-1.868
-1.23%
jan 1, 1995
148.26
-1.312
-0.88%
jan 1, 1996
145.761
-2.498
-1.68%
jan 1, 1997
142.827
-2.934
-2.01%
jan 1, 1998
140.253
-2.575
-1.8%
jan 1, 1999
137.389
-2.863
-2.04%
jan 1, 2000
133.63
-3.76
-2.74%
jan 1, 2001
129.749
-3.88
-2.9%
jan 1, 2002
125.532
-4.217
-3.25%
jan 1, 2003
121.041
-4.491
-3.58%
jan 1, 2004
116.455
-4.586
-3.79%
jan 1, 2005
111.97
-4.485
-3.85%
jan 1, 2006
107.329
-4.641
-4.15%
jan 1, 2007
102.948
-4.381
-4.08%
jan 1, 2008
98.688
-4.26
-4.14%
jan 1, 2009
95.134
-3.555
-3.6%
jan 1, 2010
90.781
-4.353
-4.58%
jan 1, 2011
87.93
-2.851
-3.14%
jan 1, 2012
83.857
-4.073
-4.63%
jan 1, 2013
80.64
-3.217
-3.84%
jan 1, 2014
77.742
-2.898
-3.59%
jan 1, 2015
75.052
-2.69
-3.46%
jan 1, 2016
72.659
-2.393
-3.19%
Ranking of countries by current statistics by years


Comments: