29
/
en
AIzaSyAYiBZKx7MnpbEhh9jyipgxe19OcubqV5w
April 1, 2024
282417
Vietnam
VNM
true
2
1
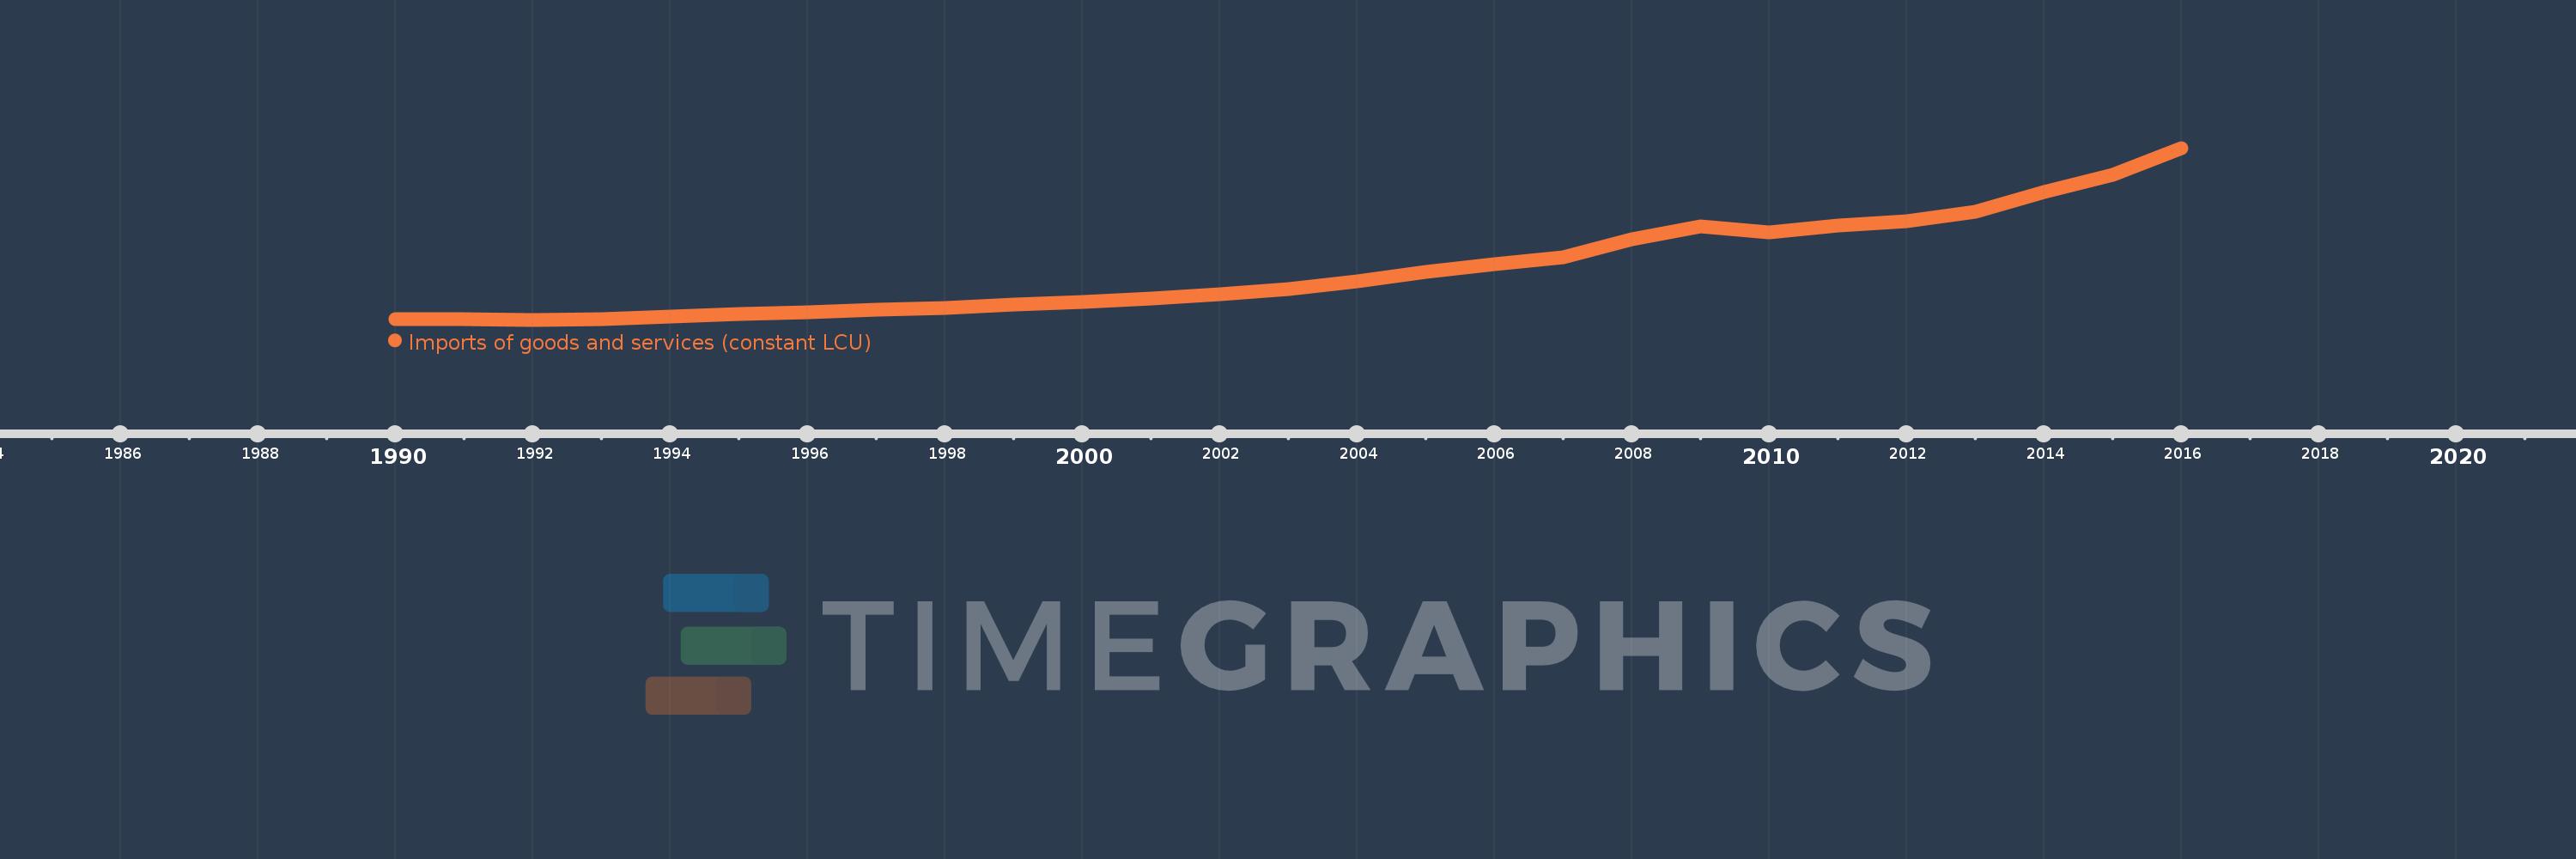
Imports of goods and services (constant LCU)
2016,2015,2014,2013,2012,2011,2010,2009,2008,2007,2006,2005,2004,2003,2002,2001,2000,1999,1998,1997,1996,1995,1994,1993,1992,1991,1990
This statistics in other country:
AlbaniaAlgeriaAngolaAntigua and BarbudaArgentinaArmeniaAustraliaAustriaAzerbaijanBahamas, TheBahrainBangladeshBarbadosBelarusBelgiumBelizeBeninBhutanBoliviaBosnia and HerzegovinaBotswanaBrazilBrunei DarussalamBulgariaBurkina FasoBurundiCabo VerdeCambodiaCameroonCanadaChadChileColombiaComorosCongo, Dem. Rep.Congo, Rep.Costa RicaCote d'IvoireCroatiaCubaCyprusCzech RepublicDenmarkDjiboutiDominican RepublicEcuadorEgypt, Arab Rep.El SalvadorEquatorial GuineaEritreaEstoniaEthiopiaFijiFinlandFranceGabonGambia, TheGeorgiaGermanyGhanaGreeceGuatemalaGuineaGuinea-BissauHaitiHondurasHong Kong SAR, ChinaHungaryIcelandIndiaIndonesiaIran, Islamic Rep.IrelandIsraelItalyJamaicaJapanJordanKazakhstanKenyaKorea, Rep.KosovoKuwaitKyrgyz RepublicLao PDRLatviaLebanonLiberiaLibyaLithuaniaLuxembourgMacao SAR, ChinaMacedonia, FYRMadagascarMalawiMalaysiaMaliMaltaMauritaniaMauritiusMexicoMoldovaMongoliaMontenegroMoroccoMozambiqueMyanmarNamibiaNepalNetherlandsNew ZealandNicaraguaNigerNigeriaNorwayOmanPakistanPanamaPapua New GuineaParaguayPeruPhilippinesPolandPortugalPuerto RicoQatarRomaniaRussian FederationRwandaSamoaSaudi ArabiaSenegalSerbiaSeychellesSierra LeoneSingaporeSlovak RepublicSloveniaSomaliaSouth AfricaSouth SudanSpainSri LankaSudanSurinameSwazilandSwedenSwitzerlandSyrian Arab RepublicTajikistanTanzaniaThailandTimor-LesteTogoTrinidad and TobagoTunisiaTurkeyTurkmenistanUgandaUkraineUnited Arab EmiratesUnited KingdomUnited StatesUruguayUzbekistanVanuatuVenezuela, RBVietnamWest Bank and GazaZambiaZimbabwe Timeline:
This timeline shows a graph from 1990 to 2016 of Vietnam. No data until 1989. Number of actual observations by date: 27.
Source name:
World Development Indicators
Source organization:
World Bank national accounts data, and OECD National Accounts data files.
Categories, topics:
Economy & Growth
Last updated:
apr 23, 2017
Indicators value changes by year
Minimum:
85.625 trl
jan 1, 1992
Maximum:
3073.334 trl
jan 1, 2016
At the date of observation
Value
Absolute change
Change from previous value
jan 1, 1990
95.743 trl
+95.743 trl
0.0%
jan 1, 1991
91.438 trl
-4.305 trl
-4.5%
jan 1, 1992
85.625 trl
-5.813 trl
-6.36%
jan 1, 1993
101.717 trl
+16.092 trl
18.79%
jan 1, 1994
144.258 trl
+42.541 trl
41.82%
jan 1, 1995
189.651 trl
+45.393 trl
31.47%
jan 1, 1996
220.498 trl
+30.847 trl
16.27%
jan 1, 1997
267.467 trl
+46.969 trl
21.3%
jan 1, 1998
293.29 trl
+25.822 trl
9.65%
jan 1, 1999
347.231 trl
+53.941 trl
18.39%
jan 1, 2000
390.827 trl
+43.597 trl
12.56%
jan 1, 2001
455.76 trl
+64.933 trl
16.61%
jan 1, 2002
530.696 trl
+74.936 trl
16.44%
jan 1, 2003
614.471 trl
+83.775 trl
15.79%
jan 1, 2004
754.108 trl
+139.637 trl
22.72%
jan 1, 2005
919.553 trl
+165.445 trl
21.94%
jan 1, 2006
1049.91 trl
+130.357 trl
14.18%
jan 1, 2007
1175.778 trl
+125.868 trl
11.99%
jan 1, 2008
1492.434 trl
+316.656 trl
26.93%
jan 1, 2009
1716.467 trl
+224.033 trl
15.01%
jan 1, 2010
1599.387 trl
-117.08 trl
-6.82%
jan 1, 2011
1730.902 trl
+131.515 trl
8.22%
jan 1, 2012
1801.807 trl
+70.905 trl
4.1%
jan 1, 2013
1965.677 trl
+163.87 trl
9.09%
jan 1, 2014
2306.613 trl
+340.936 trl
17.34%
jan 1, 2015
2601.967 trl
+295.354 trl
12.8%
jan 1, 2016
3073.334 trl
+471.367 trl
18.12%
Ranking of countries by current statistics by years


Comments: