29
/
en
AIzaSyAYiBZKx7MnpbEhh9jyipgxe19OcubqV5w
April 1, 2024
269457
Turkey
TUR
true
2
1
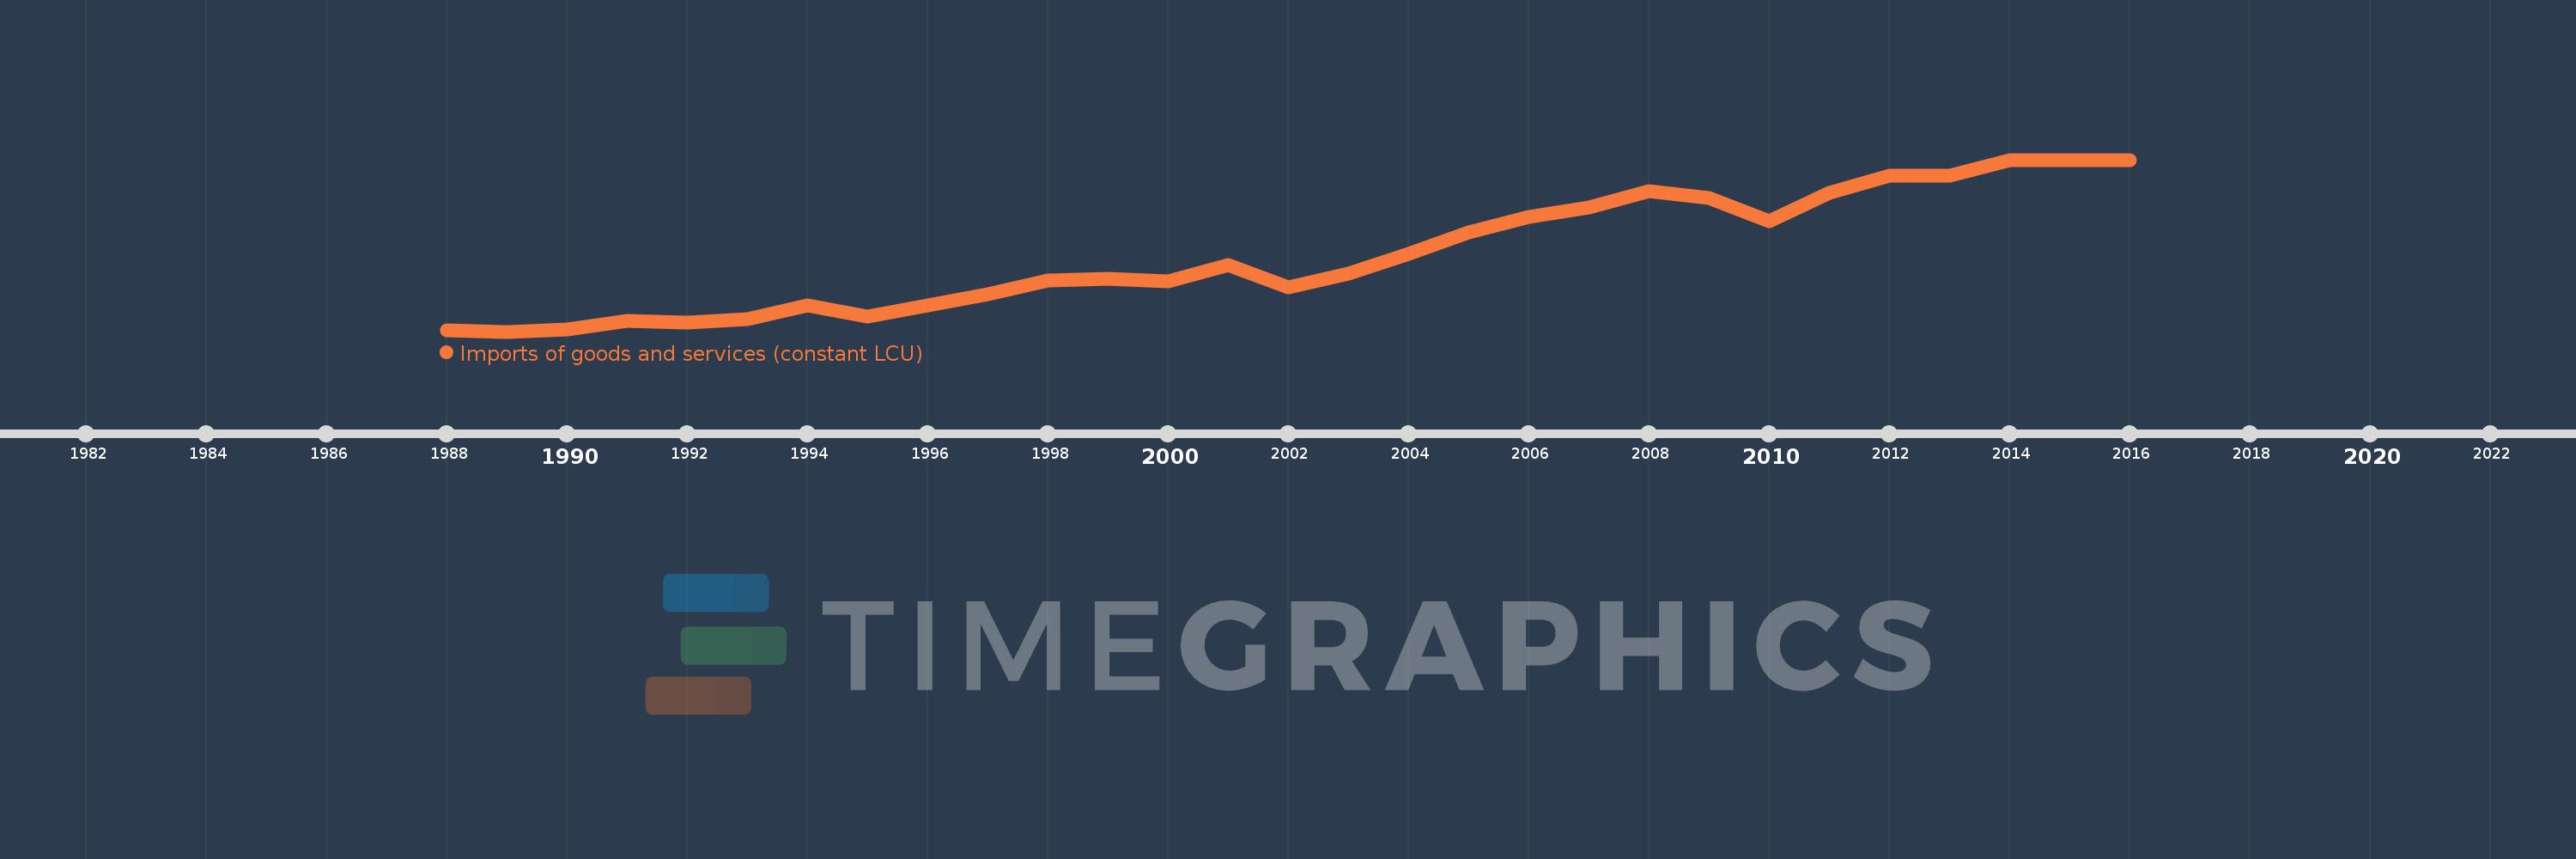
Imports of goods and services (constant LCU)
2016,2015,2014,2013,2012,2011,2010,2009,2008,2007,2006,2005,2004,2003,2002,2001,2000,1999,1998,1997,1996,1995,1994,1993,1992,1991,1990,1989,1988
This statistics in other country:
AlbaniaAlgeriaAngolaAntigua and BarbudaArgentinaArmeniaAustraliaAustriaAzerbaijanBahamas, TheBahrainBangladeshBarbadosBelarusBelgiumBelizeBeninBhutanBoliviaBosnia and HerzegovinaBotswanaBrazilBrunei DarussalamBulgariaBurkina FasoBurundiCabo VerdeCambodiaCameroonCanadaChadChileColombiaComorosCongo, Dem. Rep.Congo, Rep.Costa RicaCote d'IvoireCroatiaCubaCyprusCzech RepublicDenmarkDjiboutiDominican RepublicEcuadorEgypt, Arab Rep.El SalvadorEquatorial GuineaEritreaEstoniaEthiopiaFijiFinlandFranceGabonGambia, TheGeorgiaGermanyGhanaGreeceGuatemalaGuineaGuinea-BissauHaitiHondurasHong Kong SAR, ChinaHungaryIcelandIndiaIndonesiaIran, Islamic Rep.IrelandIsraelItalyJamaicaJapanJordanKazakhstanKenyaKorea, Rep.KosovoKuwaitKyrgyz RepublicLao PDRLatviaLebanonLiberiaLibyaLithuaniaLuxembourgMacao SAR, ChinaMacedonia, FYRMadagascarMalawiMalaysiaMaliMaltaMauritaniaMauritiusMexicoMoldovaMongoliaMontenegroMoroccoMozambiqueMyanmarNamibiaNepalNetherlandsNew ZealandNicaraguaNigerNigeriaNorwayOmanPakistanPanamaPapua New GuineaParaguayPeruPhilippinesPolandPortugalPuerto RicoQatarRomaniaRussian FederationRwandaSamoaSaudi ArabiaSenegalSerbiaSeychellesSierra LeoneSingaporeSlovak RepublicSloveniaSomaliaSouth AfricaSouth SudanSpainSri LankaSudanSurinameSwazilandSwedenSwitzerlandSyrian Arab RepublicTajikistanTanzaniaThailandTimor-LesteTogoTrinidad and TobagoTunisiaTurkeyTurkmenistanUgandaUkraineUnited Arab EmiratesUnited KingdomUnited StatesUruguayUzbekistanVanuatuVenezuela, RBVietnamWest Bank and GazaZambiaZimbabwe Timeline:
This timeline shows a graph from 1988 to 2016 of Turkey. No data until 1987. Number of actual observations by date: 29.
Source name:
World Development Indicators
Source organization:
World Bank national accounts data, and OECD National Accounts data files.
Categories, topics:
Economy & Growth
Last updated:
apr 23, 2017
Indicators value changes by year
Minimum:
4.566 bln
jan 1, 1989
Maximum:
35.65 bln
jan 1, 2014
At the date of observation
Value
Absolute change
Change from previous value
jan 1, 1988
4.782 bln
+4.782 bln
0.0%
jan 1, 1989
4.566 bln
-215.824 mln
-4.51%
jan 1, 1990
4.88 bln
+314.709 mln
6.89%
jan 1, 1991
6.496 bln
+1.616 bln
33.11%
jan 1, 1992
6.153 bln
-343.322 mln
-5.28%
jan 1, 1993
6.825 bln
+671.616 mln
10.92%
jan 1, 1994
9.267 bln
+2.442 bln
35.79%
jan 1, 1995
7.24 bln
-2.027 bln
-21.88%
jan 1, 1996
9.382 bln
+2.142 bln
29.58%
jan 1, 1997
11.307 bln
+1.925 bln
20.52%
jan 1, 1998
13.844 bln
+2.537 bln
22.44%
jan 1, 1999
14.167 bln
+323.141 mln
2.33%
jan 1, 2000
13.641 bln
-526.244 mln
-3.71%
jan 1, 2001
16.608 bln
+2.967 bln
21.75%
jan 1, 2002
12.497 bln
-4.111 bln
-24.76%
jan 1, 2003
15.104 bln
+2.608 bln
20.87%
jan 1, 2004
18.657 bln
+3.553 bln
23.52%
jan 1, 2005
22.545 bln
+3.888 bln
20.84%
jan 1, 2006
25.29 bln
+2.744 bln
12.17%
jan 1, 2007
27.032 bln
+1.742 bln
6.89%
jan 1, 2008
29.914 bln
+2.882 bln
10.66%
jan 1, 2009
28.679 bln
-1.235 bln
-4.13%
jan 1, 2010
24.578 bln
-4.1 bln
-14.3%
jan 1, 2011
29.667 bln
+5.088 bln
20.7%
jan 1, 2012
32.834 bln
+3.167 bln
10.68%
jan 1, 2013
32.704 bln
-129.571 mln
-0.39%
jan 1, 2014
35.65 bln
+2.945 bln
9.01%
jan 1, 2015
35.55 bln
-99.444 mln
-0.28%
jan 1, 2016
35.625 bln
+74.633 mln
0.21%
Ranking of countries by current statistics by years


Comments: