29
/
en
AIzaSyAYiBZKx7MnpbEhh9jyipgxe19OcubqV5w
April 1, 2024
197681
Moldova
MDA
true
2
1
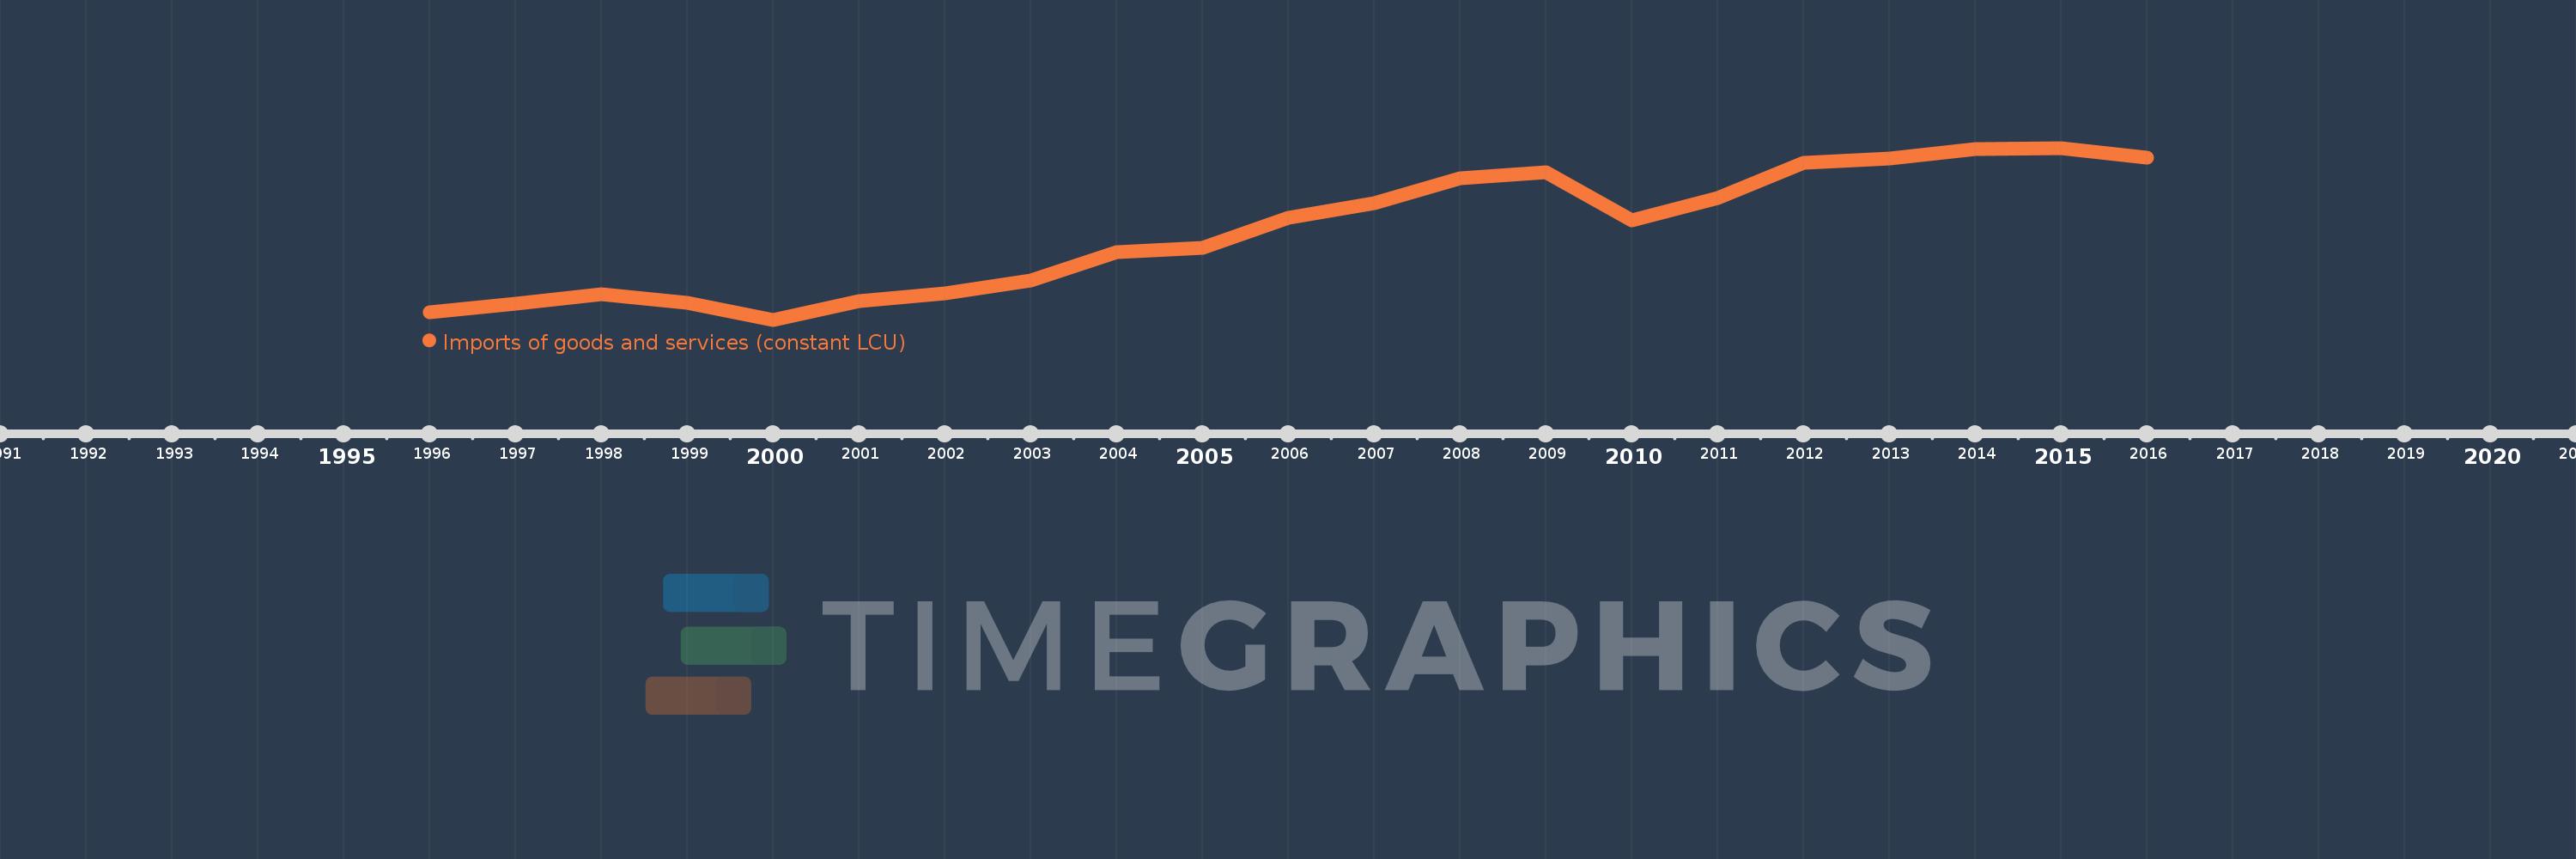
Imports of goods and services (constant LCU)
2016,2015,2014,2013,2012,2011,2010,2009,2008,2007,2006,2005,2004,2003,2002,2001,2000,1999,1998,1997,1996
This statistics in other country:
AlbaniaAlgeriaAngolaAntigua and BarbudaArgentinaArmeniaAustraliaAustriaAzerbaijanBahamas, TheBahrainBangladeshBarbadosBelarusBelgiumBelizeBeninBhutanBoliviaBosnia and HerzegovinaBotswanaBrazilBrunei DarussalamBulgariaBurkina FasoBurundiCabo VerdeCambodiaCameroonCanadaChadChileColombiaComorosCongo, Dem. Rep.Congo, Rep.Costa RicaCote d'IvoireCroatiaCubaCyprusCzech RepublicDenmarkDjiboutiDominican RepublicEcuadorEgypt, Arab Rep.El SalvadorEquatorial GuineaEritreaEstoniaEthiopiaFijiFinlandFranceGabonGambia, TheGeorgiaGermanyGhanaGreeceGuatemalaGuineaGuinea-BissauHaitiHondurasHong Kong SAR, ChinaHungaryIcelandIndiaIndonesiaIran, Islamic Rep.IrelandIsraelItalyJamaicaJapanJordanKazakhstanKenyaKorea, Rep.KosovoKuwaitKyrgyz RepublicLao PDRLatviaLebanonLiberiaLibyaLithuaniaLuxembourgMacao SAR, ChinaMacedonia, FYRMadagascarMalawiMalaysiaMaliMaltaMauritaniaMauritiusMexicoMoldovaMongoliaMontenegroMoroccoMozambiqueMyanmarNamibiaNepalNetherlandsNew ZealandNicaraguaNigerNigeriaNorwayOmanPakistanPanamaPapua New GuineaParaguayPeruPhilippinesPolandPortugalPuerto RicoQatarRomaniaRussian FederationRwandaSamoaSaudi ArabiaSenegalSerbiaSeychellesSierra LeoneSingaporeSlovak RepublicSloveniaSomaliaSouth AfricaSouth SudanSpainSri LankaSudanSurinameSwazilandSwedenSwitzerlandSyrian Arab RepublicTajikistanTanzaniaThailandTimor-LesteTogoTrinidad and TobagoTunisiaTurkeyTurkmenistanUgandaUkraineUnited Arab EmiratesUnited KingdomUnited StatesUruguayUzbekistanVanuatuVenezuela, RBVietnamWest Bank and GazaZambiaZimbabwe Timeline:
This timeline shows a graph from 1996 to 2016 of Moldova. No data until 1995. Number of actual observations by date: 21.
Source name:
World Development Indicators
Source organization:
World Bank national accounts data, and OECD National Accounts data files.
Categories, topics:
Economy & Growth
Last updated:
apr 23, 2017
Indicators value changes by year
Minimum:
9.272 bln
jan 1, 2000
Maximum:
37.23 bln
jan 1, 2015
At the date of observation
Value
Absolute change
Change from previous value
jan 1, 1996
10.434 bln
+10.434 bln
0.0%
jan 1, 1997
11.906 bln
+1.472 bln
14.11%
jan 1, 1998
13.37 bln
+1.464 bln
12.3%
jan 1, 1999
11.983 bln
-1.388 bln
-10.38%
jan 1, 2000
9.272 bln
-2.711 bln
-22.62%
jan 1, 2001
12.265 bln
+2.993 bln
32.28%
jan 1, 2002
13.566 bln
+1.301 bln
10.61%
jan 1, 2003
15.7 bln
+2.133 bln
15.73%
jan 1, 2004
20.213 bln
+4.513 bln
28.75%
jan 1, 2005
20.941 bln
+727.925 mln
3.6%
jan 1, 2006
25.847 bln
+4.906 bln
23.43%
jan 1, 2007
28.197 bln
+2.35 bln
9.09%
jan 1, 2008
32.307 bln
+4.11 bln
14.58%
jan 1, 2009
33.23 bln
+922.774 mln
2.86%
jan 1, 2010
25.402 bln
-7.828 bln
-23.56%
jan 1, 2011
29.034 bln
+3.632 bln
14.3%
jan 1, 2012
34.754 bln
+5.72 bln
19.7%
jan 1, 2013
35.519 bln
+764.588 mln
2.2%
jan 1, 2014
37.081 bln
+1.563 bln
4.4%
jan 1, 2015
37.23 bln
+148.326 mln
0.4%
jan 1, 2016
35.629 bln
-1.601 bln
-4.3%
Ranking of countries by current statistics by years


Comments: