29
/
en
AIzaSyAYiBZKx7MnpbEhh9jyipgxe19OcubqV5w
April 1, 2024
152649
Hungary
HUN
true
2
1
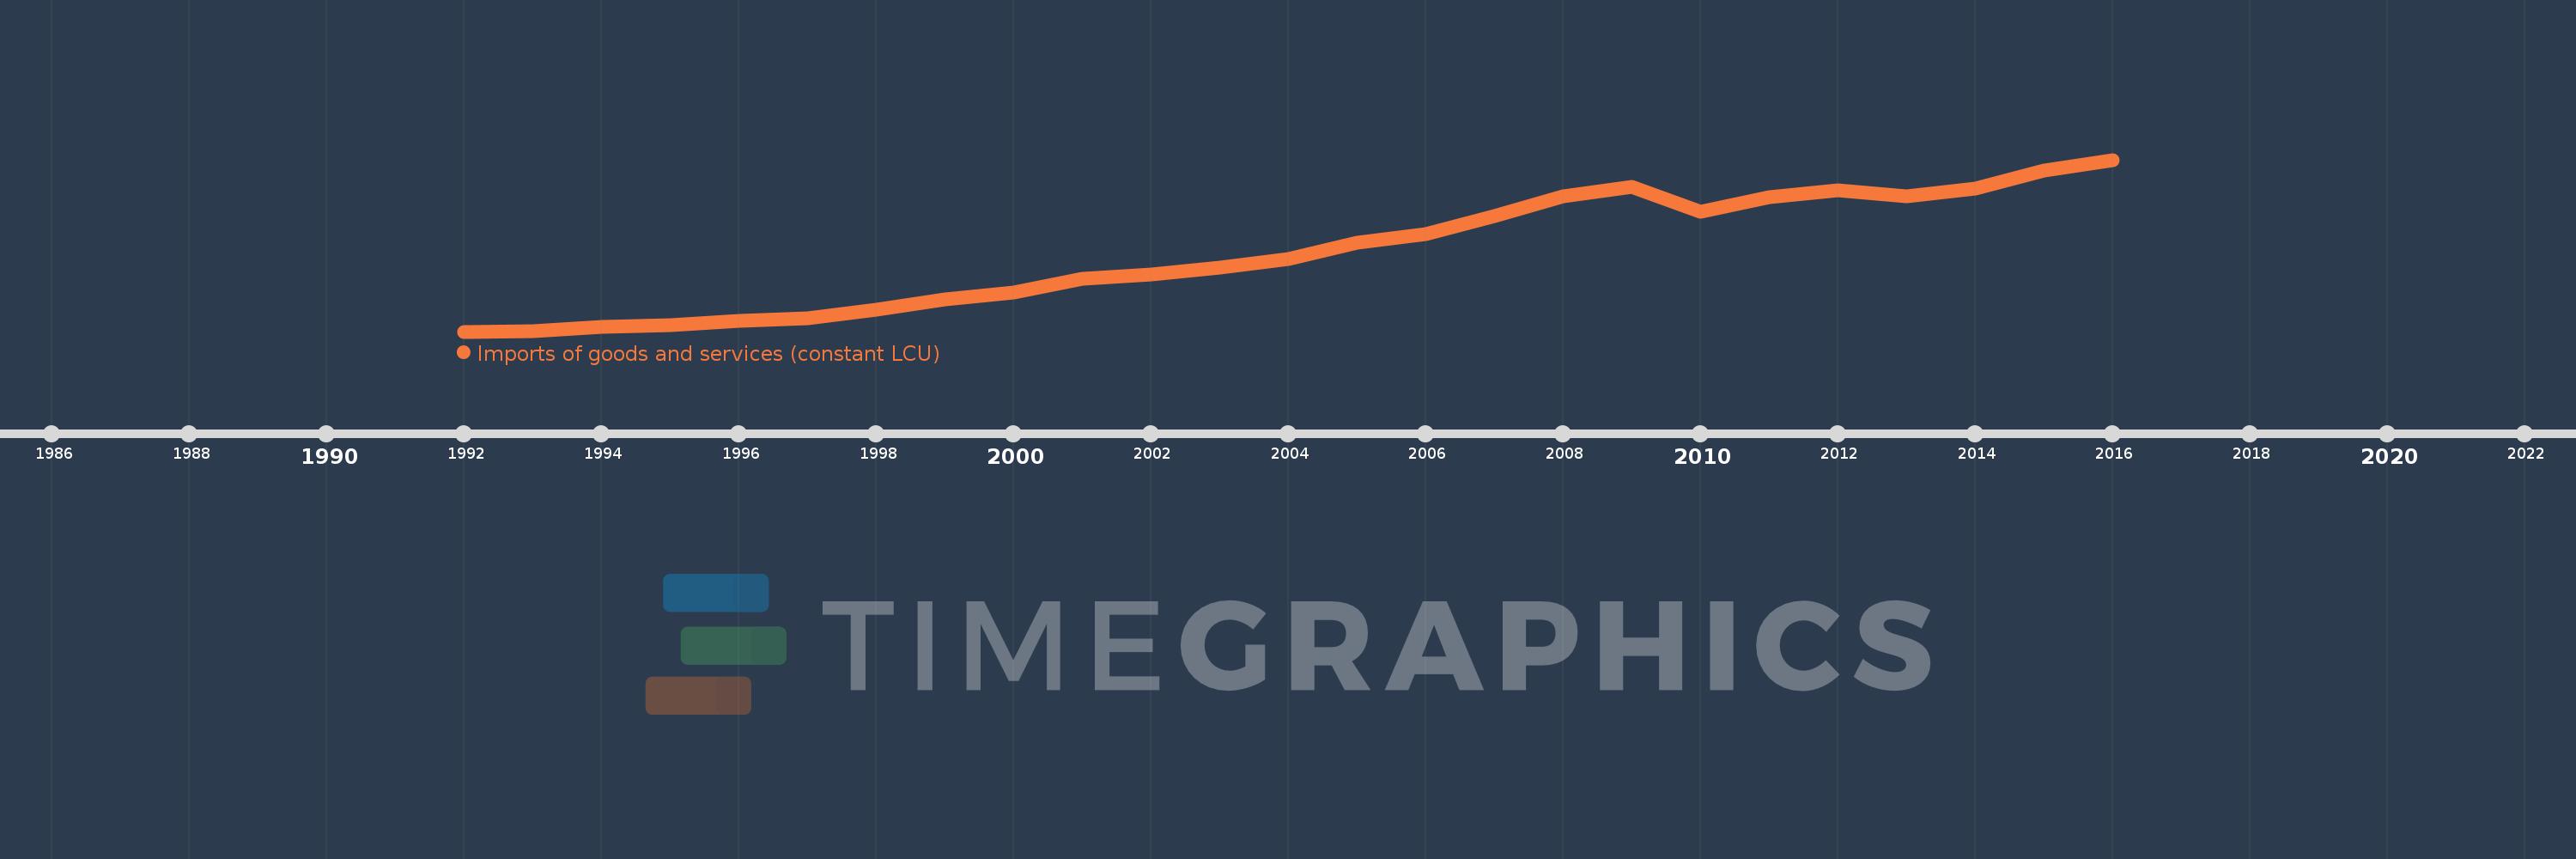
Imports of goods and services (constant LCU)
2016,2015,2014,2013,2012,2011,2010,2009,2008,2007,2006,2005,2004,2003,2002,2001,2000,1999,1998,1997,1996,1995,1994,1993,1992
This statistics in other country:
AlbaniaAlgeriaAngolaAntigua and BarbudaArgentinaArmeniaAustraliaAustriaAzerbaijanBahamas, TheBahrainBangladeshBarbadosBelarusBelgiumBelizeBeninBhutanBoliviaBosnia and HerzegovinaBotswanaBrazilBrunei DarussalamBulgariaBurkina FasoBurundiCabo VerdeCambodiaCameroonCanadaChadChileColombiaComorosCongo, Dem. Rep.Congo, Rep.Costa RicaCote d'IvoireCroatiaCubaCyprusCzech RepublicDenmarkDjiboutiDominican RepublicEcuadorEgypt, Arab Rep.El SalvadorEquatorial GuineaEritreaEstoniaEthiopiaFijiFinlandFranceGabonGambia, TheGeorgiaGermanyGhanaGreeceGuatemalaGuineaGuinea-BissauHaitiHondurasHong Kong SAR, ChinaHungaryIcelandIndiaIndonesiaIran, Islamic Rep.IrelandIsraelItalyJamaicaJapanJordanKazakhstanKenyaKorea, Rep.KosovoKuwaitKyrgyz RepublicLao PDRLatviaLebanonLiberiaLibyaLithuaniaLuxembourgMacao SAR, ChinaMacedonia, FYRMadagascarMalawiMalaysiaMaliMaltaMauritaniaMauritiusMexicoMoldovaMongoliaMontenegroMoroccoMozambiqueMyanmarNamibiaNepalNetherlandsNew ZealandNicaraguaNigerNigeriaNorwayOmanPakistanPanamaPapua New GuineaParaguayPeruPhilippinesPolandPortugalPuerto RicoQatarRomaniaRussian FederationRwandaSamoaSaudi ArabiaSenegalSerbiaSeychellesSierra LeoneSingaporeSlovak RepublicSloveniaSomaliaSouth AfricaSouth SudanSpainSri LankaSudanSurinameSwazilandSwedenSwitzerlandSyrian Arab RepublicTajikistanTanzaniaThailandTimor-LesteTogoTrinidad and TobagoTunisiaTurkeyTurkmenistanUgandaUkraineUnited Arab EmiratesUnited KingdomUnited StatesUruguayUzbekistanVanuatuVenezuela, RBVietnamWest Bank and GazaZambiaZimbabwe Timeline:
This timeline shows a graph from 1992 to 2016 of Hungary. No data until 1991. Number of actual observations by date: 25.
Source name:
World Development Indicators
Source organization:
World Bank national accounts data, and OECD National Accounts data files.
Categories, topics:
Economy & Growth
Last updated:
apr 23, 2017
Indicators value changes by year
Minimum:
2.911 trl
jan 1, 1992
Maximum:
25.83 trl
jan 1, 2016
At the date of observation
Value
Absolute change
Change from previous value
jan 1, 1992
2.911 trl
+2.911 trl
0.0%
jan 1, 1993
2.918 trl
+7.188 bln
0.25%
jan 1, 1994
3.509 trl
+590.704 bln
20.24%
jan 1, 1995
3.819 trl
+310.313 bln
8.84%
jan 1, 1996
4.394 trl
+574.813 bln
15.05%
jan 1, 1997
4.706 trl
+312.125 bln
7.1%
jan 1, 1998
5.837 trl
+1.131 trl
24.04%
jan 1, 1999
7.157 trl
+1.32 trl
22.62%
jan 1, 2000
8.108 trl
+950.868 bln
13.29%
jan 1, 2001
9.983 trl
+1.875 trl
23.13%
jan 1, 2002
10.563 trl
+579.891 bln
5.81%
jan 1, 2003
11.479 trl
+916.558 bln
8.68%
jan 1, 2004
12.569 trl
+1.089 trl
9.49%
jan 1, 2005
14.741 trl
+2.172 trl
17.28%
jan 1, 2006
15.898 trl
+1.157 trl
7.85%
jan 1, 2007
18.363 trl
+2.465 trl
15.51%
jan 1, 2008
20.917 trl
+2.553 trl
13.91%
jan 1, 2009
22.177 trl
+1.261 trl
6.03%
jan 1, 2010
18.913 trl
-3.264 trl
-14.72%
jan 1, 2011
20.833 trl
+1.92 trl
10.15%
jan 1, 2012
21.757 trl
+923.889 bln
4.43%
jan 1, 2013
20.999 trl
-757.963 bln
-3.48%
jan 1, 2014
21.947 trl
+947.51 bln
4.51%
jan 1, 2015
24.344 trl
+2.397 trl
10.92%
jan 1, 2016
25.83 trl
+1.486 trl
6.1%
Ranking of countries by current statistics by years


Comments: