30
/
AIzaSyAYiBZKx7MnpbEhh9jyipgxe19OcubqV5w
April 1, 2024
160605
Israel
ISR
true
2
1
Imports of goods and services (constant LCU)
2016,2015,2014,2013,2012,2011,2010,2009,2008,2007,2006,2005,2004,2003,2002,2001,2000,1999,1998,1997,1996
Public Timelines
FAQ
Menu
Public Timelines
FAQ
For education
For educational institutions
For teachers
For students
Open cabinet
Create
Close
Create a timeline
Public timelines
Library
FAQ
Download
Global statistics library
→
Israel
→
Imports of goods and services (constant LCU)
This statistics in other country:
Albania
Algeria
Angola
Antigua and Barbuda
Argentina
Armenia
Australia
Austria
Azerbaijan
Bahamas, The
Bahrain
Bangladesh
Barbados
Belarus
Belgium
Belize
Benin
Bhutan
Bolivia
Bosnia and Herzegovina
Botswana
Brazil
Brunei Darussalam
Bulgaria
Burkina Faso
Burundi
Cabo Verde
Cambodia
Cameroon
Canada
Chad
Chile
Colombia
Comoros
Congo, Dem. Rep.
Congo, Rep.
Costa Rica
Cote d'Ivoire
Croatia
Cuba
Cyprus
Czech Republic
Denmark
Djibouti
Dominican Republic
Ecuador
Egypt, Arab Rep.
El Salvador
Equatorial Guinea
Eritrea
Estonia
Ethiopia
Fiji
Finland
France
Gabon
Gambia, The
Georgia
Germany
Ghana
Greece
Guatemala
Guinea
Guinea-Bissau
Haiti
Honduras
Hong Kong SAR, China
Hungary
Iceland
India
Indonesia
Iran, Islamic Rep.
Ireland
Israel
Italy
Jamaica
Japan
Jordan
Kazakhstan
Kenya
Korea, Rep.
Kosovo
Kuwait
Kyrgyz Republic
Lao PDR
Latvia
Lebanon
Liberia
Libya
Lithuania
Luxembourg
Macao SAR, China
Macedonia, FYR
Madagascar
Malawi
Malaysia
Mali
Malta
Mauritania
Mauritius
Mexico
Moldova
Mongolia
Montenegro
Morocco
Mozambique
Myanmar
Namibia
Nepal
Netherlands
New Zealand
Nicaragua
Niger
Nigeria
Norway
Oman
Pakistan
Panama
Papua New Guinea
Paraguay
Peru
Philippines
Poland
Portugal
Puerto Rico
Qatar
Romania
Russian Federation
Rwanda
Samoa
Saudi Arabia
Senegal
Serbia
Seychelles
Sierra Leone
Singapore
Slovak Republic
Slovenia
Somalia
South Africa
South Sudan
Spain
Sri Lanka
Sudan
Suriname
Swaziland
Sweden
Switzerland
Syrian Arab Republic
Tajikistan
Tanzania
Thailand
Timor-Leste
Togo
Trinidad and Tobago
Tunisia
Turkey
Turkmenistan
Uganda
Ukraine
United Arab Emirates
United Kingdom
United States
Uruguay
Uzbekistan
Vanuatu
Venezuela, RB
Vietnam
West Bank and Gaza
Zambia
Zimbabwe
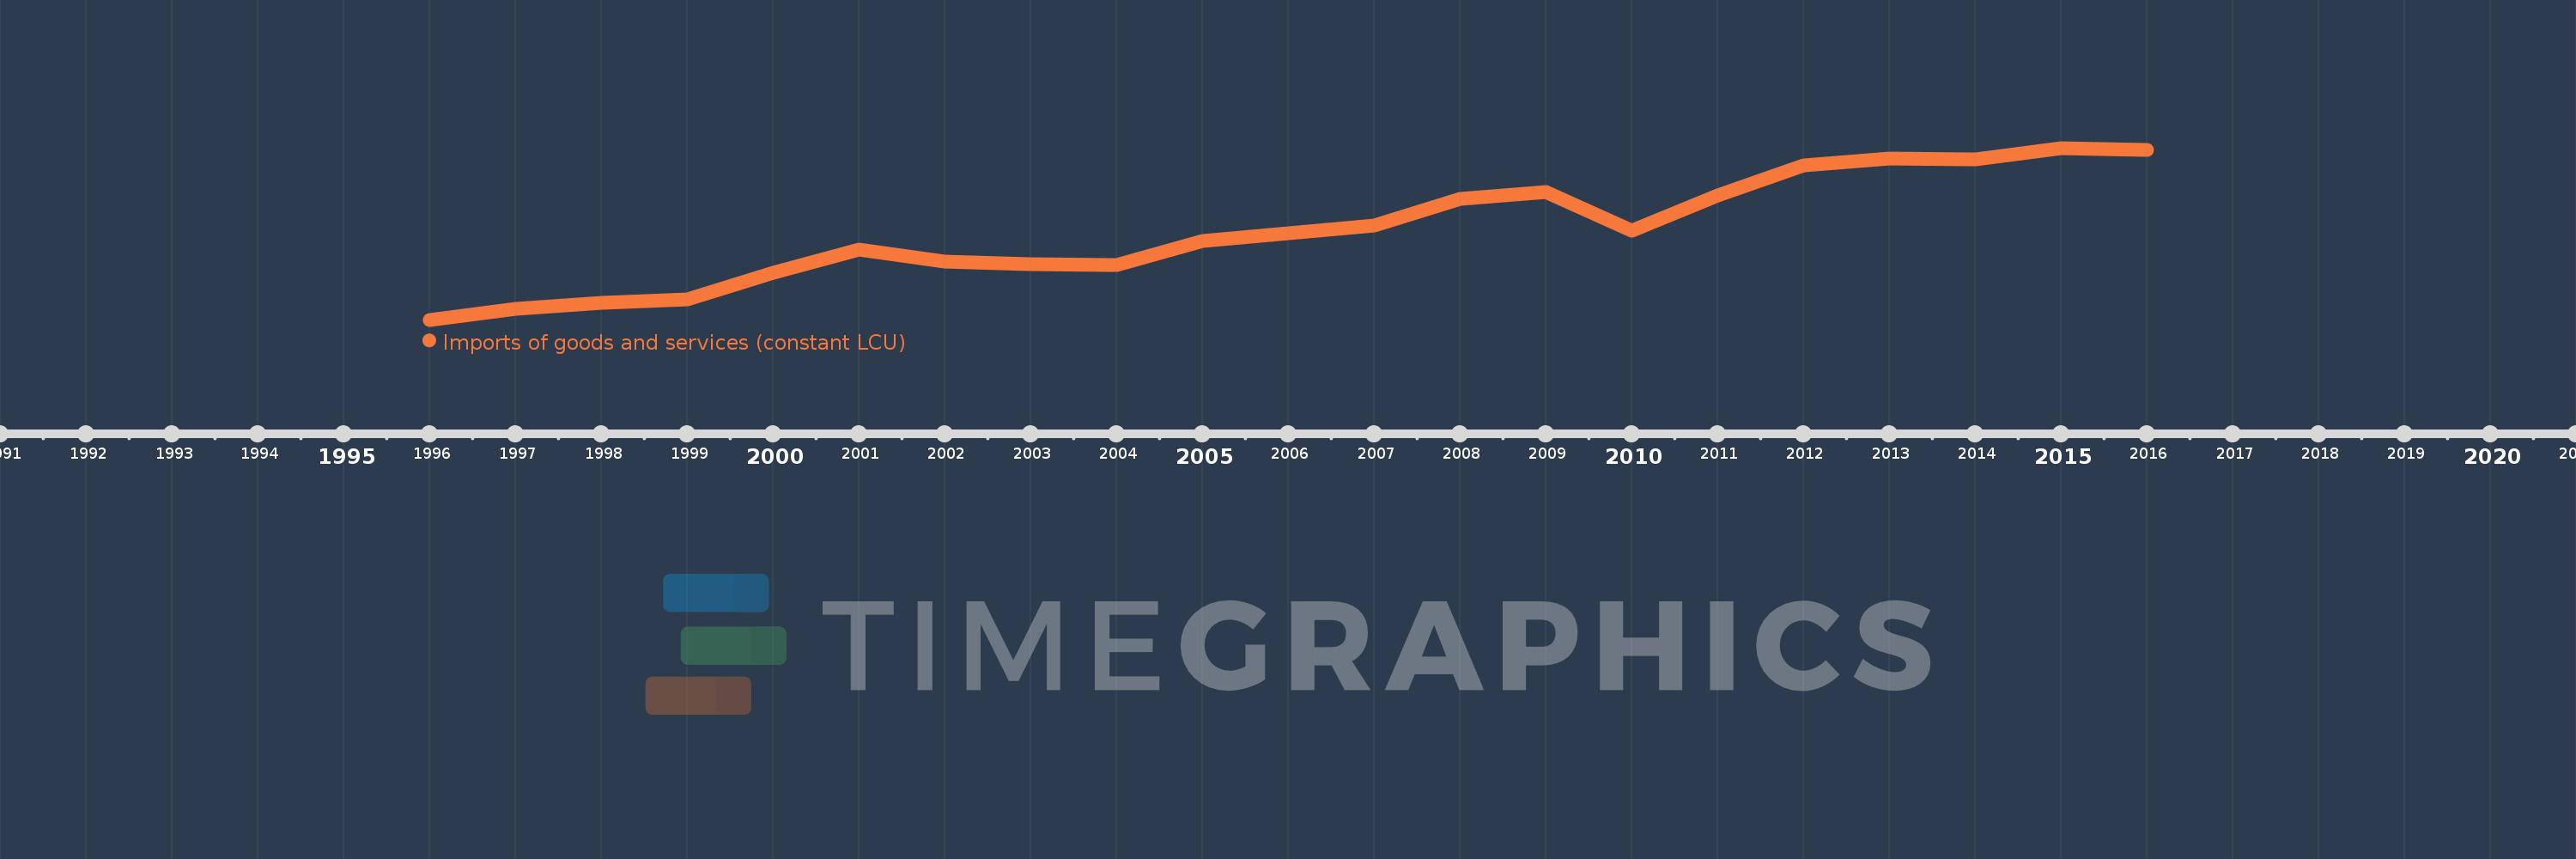
Timeline:
This timeline shows a graph from
1996
to
2016
of Israel. No data until
1995
. Number of actual observations by date:
21
.
Source name:
World Development Indicators
Source organization:
World Bank national accounts data, and OECD National Accounts data files.
Categories, topics:
Economy & Growth
Last updated:
apr 23, 2017
Indicators value changes by year
Meaning:
250.082 bln
Minimum:
155.993 bln
jan 1, 1996
Maximum:
337.192 bln
jan 1, 2015
At the date of observation
Value
Absolute change
Change from the previous value
jan 1, 1996
155.993 bln
+155.993 bln
0.0%
jan 1, 1997
167.2 bln
+11.207 bln
7.18%
jan 1, 1998
174.211 bln
+7.011 bln
4.19%
jan 1, 1999
177.888 bln
+3.678 bln
2.11%
jan 1, 2000
205.583 bln
+27.695 bln
15.57%
jan 1, 2001
230.176 bln
+24.592 bln
11.96%
jan 1, 2002
217.55 bln
-12.625 bln
-5.49%
jan 1, 2003
214.907 bln
-2.643 bln
-1.21%
jan 1, 2004
213.373 bln
-1.535 bln
-0.71%
jan 1, 2005
238.719 bln
+25.347 bln
11.88%
jan 1, 2006
247.162 bln
+8.443 bln
3.54%
jan 1, 2007
255.331 bln
+8.169 bln
3.31%
jan 1, 2008
283.523 bln
+28.192 bln
11.04%
jan 1, 2009
290.454 bln
+6.931 bln
2.44%
jan 1, 2010
249.931 bln
-40.523 bln
-13.95%
jan 1, 2011
287.459 bln
+37.528 bln
15.02%
jan 1, 2012
319.064 bln
+31.605 bln
10.99%
jan 1, 2013
325.784 bln
+6.72 bln
2.11%
jan 1, 2014
324.709 bln
-1.075 bln
-0.33%
jan 1, 2015
337.192 bln
+12.483 bln
3.84%
jan 1, 2016
335.504 bln
-1.688 bln
-0.5%
Ranking of countries by current statistics by years
About & Feedback
Terms
Privacy
Library
2024
©
Time.Graphics
Support 24/7
Cabinet
Get premium
Donate
The service accepts bank transfer (ACH, Wire) or cards (Visa, MasterCard, etc). Processed by Stripe.
Secured with SSL
Excellent (Trustpilot Reviews)
Based on 115+ reviews
Write your own review on
Trustpilot.com
