29
/
en
AIzaSyAYiBZKx7MnpbEhh9jyipgxe19OcubqV5w
April 1, 2024
280494
Vanuatu
VUT
true
2
1
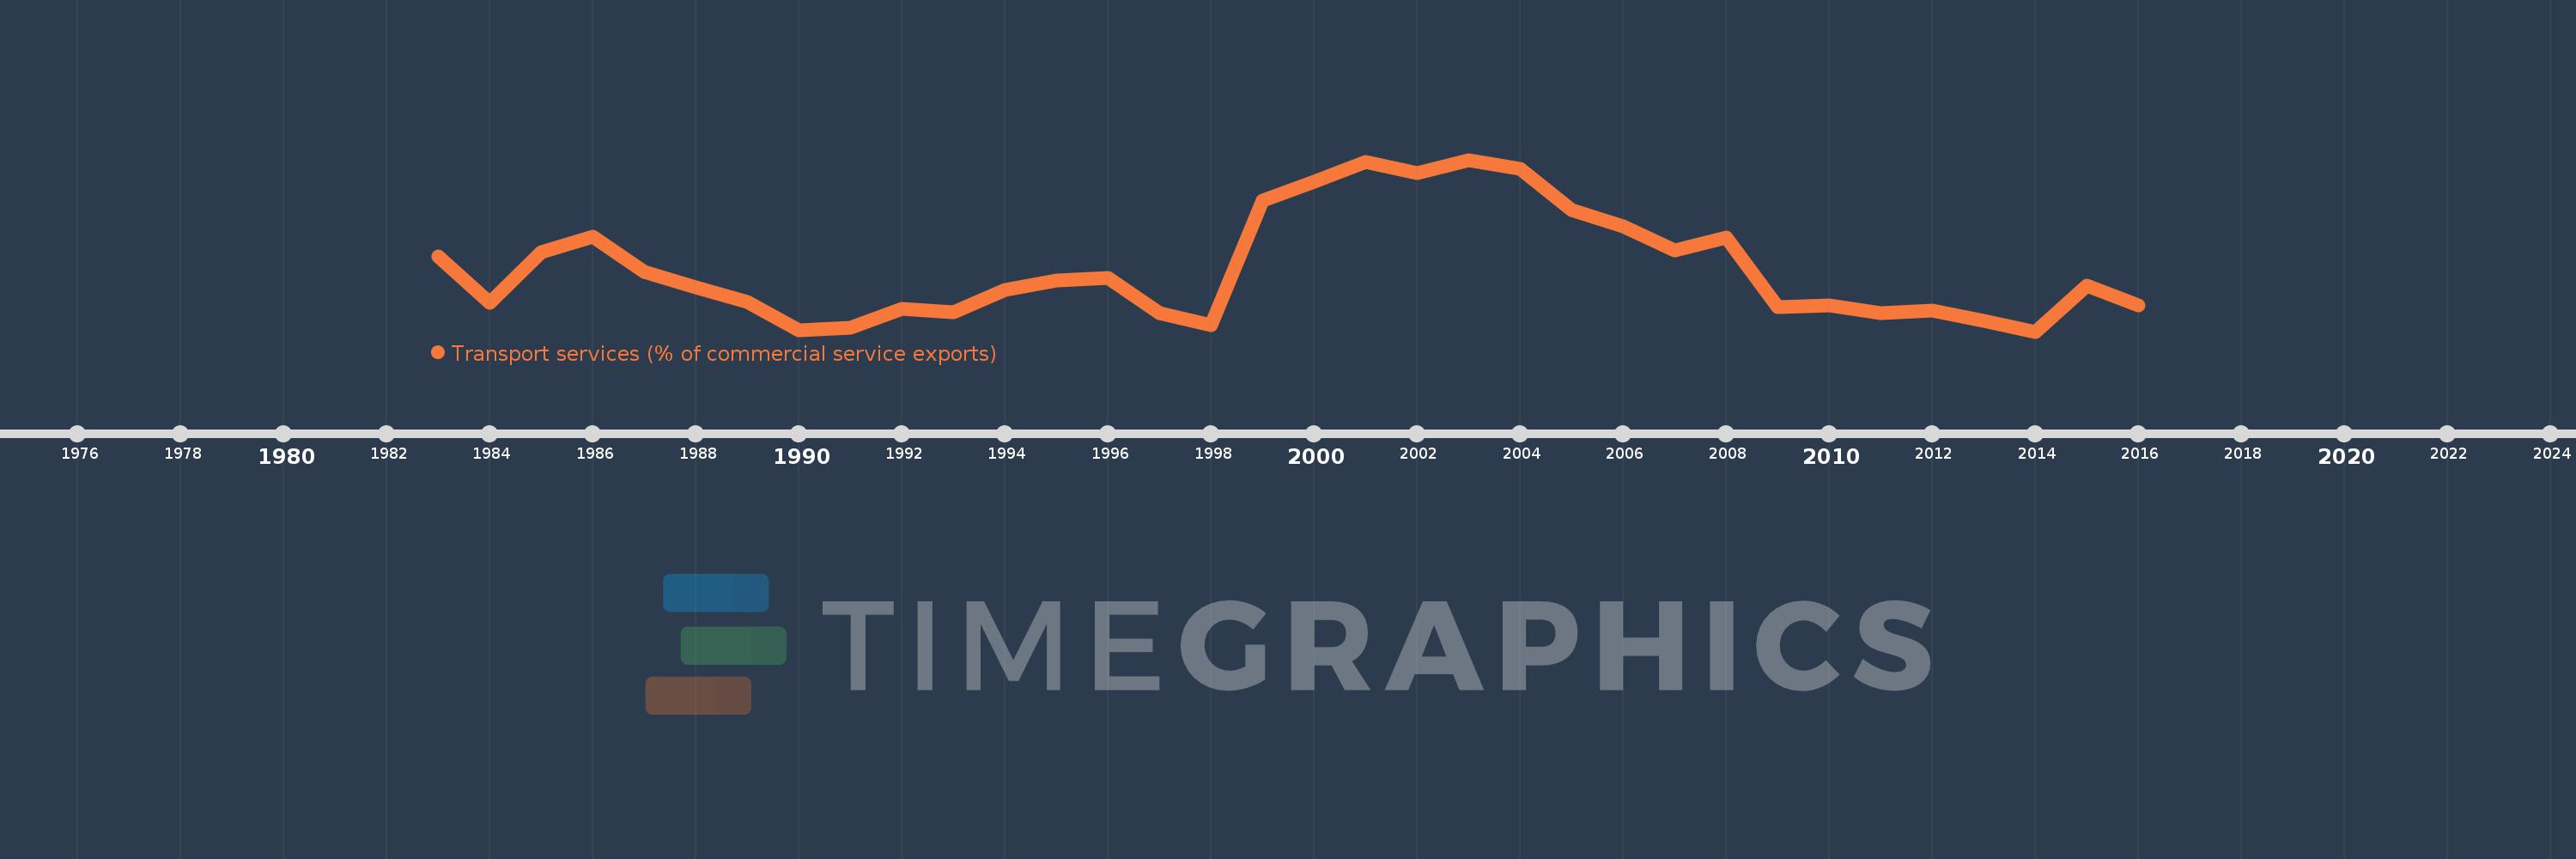
Transport services (% of commercial service exports)
2016,2015,2014,2013,2012,2011,2010,2009,2008,2007,2006,2005,2004,2003,2002,2001,2000,1999,1998,1997,1996,1995,1994,1993,1992,1991,1990,1989,1988,1987,1986,1985,1984,1983
This statistics in other country:
AfghanistanAlbaniaAlgeriaAngolaAntigua and BarbudaArab WorldArgentinaArmeniaArubaAustraliaAustriaAzerbaijanBahamas, TheBahrainBangladeshBarbadosBelarusBelgiumBelizeBeninBermudaBhutanBoliviaBosnia and HerzegovinaBotswanaBrazilBrunei DarussalamBulgariaBurkina FasoBurundiCabo VerdeCambodiaCameroonCanadaCaribbean small statesCentral African RepublicCentral Europe and the BalticsChadChileChinaColombiaComorosCongo, Dem. Rep.Congo, Rep.Costa RicaCote d'IvoireCroatiaCuracaoCyprusCzech RepublicDenmarkDjiboutiDominicaDominican RepublicEarly-demographic dividendEast Asia & PacificEast Asia & Pacific (excluding high income)East Asia & Pacific (IDA & IBRD countries)EcuadorEgypt, Arab Rep.El SalvadorEritreaEstoniaEthiopiaEuro areaEurope & Central AsiaEurope & Central Asia (excluding high income)Europe & Central Asia (IDA & IBRD countries)European UnionFaroe IslandsFijiFinlandFragile and conflict affected situationsFranceFrench PolynesiaGabonGambia, TheGeorgiaGermanyGhanaGreeceGrenadaGuatemalaGuineaGuinea-BissauGuyanaHaitiHeavily indebted poor countries (HIPC)High incomeHondurasHong Kong SAR, ChinaHungaryIBRD onlyIcelandIDA & IBRD totalIDA onlyIDA totalIndiaIndonesiaIran, Islamic Rep.IraqIrelandIsraelItalyJamaicaJapanJordanKazakhstanKenyaKiribatiKorea, Rep.KosovoKuwaitKyrgyz RepublicLao PDRLate-demographic dividendLatin America & Caribbean Latin America & Caribbean (excluding high income)Latin America & the Caribbean (IDA & IBRD countries)LatviaLeast developed countries: UN classificationLebanonLesothoLiberiaLibyaLithuaniaLow & middle incomeLow incomeLower middle incomeLuxembourgMacao SAR, ChinaMacedonia, FYRMadagascarMalawiMalaysiaMaldivesMaliMaltaMarshall IslandsMauritaniaMauritiusMexicoMicronesia, Fed. Sts.Middle East & North AfricaMiddle East & North Africa (excluding high income)Middle East & North Africa (IDA & IBRD countries)Middle incomeMoldovaMongoliaMontenegroMoroccoMozambiqueMyanmarNamibiaNepalNetherlandsNew CaledoniaNew ZealandNicaraguaNigerNigeriaNorth AmericaNorwayOECD membersOmanOther small statesPacific island small statesPakistanPalauPanamaPapua New GuineaParaguayPeruPhilippinesPolandPortugalPost-demographic dividendPre-demographic dividendQatarRomaniaRussian FederationRwandaSamoaSao Tome and PrincipeSaudi ArabiaSenegalSerbiaSeychellesSierra LeoneSingaporeSint Maarten (Dutch part)Slovak RepublicSloveniaSmall statesSolomon IslandsSouth AfricaSouth AsiaSouth Asia (IDA & IBRD)South SudanSpainSri LankaSt. Kitts and NevisSt. LuciaSt. Vincent and the GrenadinesSub-Saharan Africa Sub-Saharan Africa (excluding high income)Sub-Saharan Africa (IDA & IBRD countries)SudanSurinameSwazilandSwedenSwitzerlandSyrian Arab RepublicTajikistanTanzaniaThailandTimor-LesteTogoTongaTrinidad and TobagoTunisiaTurkeyTuvaluUgandaUkraineUnited KingdomUnited StatesUpper middle incomeUruguayVanuatuVenezuela, RBWest Bank and GazaWorldYemen, Rep.ZambiaZimbabwe Timeline:
This timeline shows a graph from 1983 to 2016 of Vanuatu. No data until 1982. Number of actual observations by date: 34.
Source name:
World Development Indicators
Source organization:
International Monetary Fund, Balance of Payments Statistics Yearbook and data files.
Categories, topics:
Private Sector, Trade
Last updated:
apr 23, 2017
Indicators value changes by year
Minimum:
10.001
jan 1, 2014
Maximum:
25.199
jan 1, 2003
At the date of observation
Value
Absolute change
Change from previous value
jan 1, 1983
16.623
+16.623
0.0%
jan 1, 1984
12.572
-4.051
-24.37%
jan 1, 1985
17.042
+4.47
35.55%
jan 1, 1986
18.389
+1.347
7.9%
jan 1, 1987
15.278
-3.111
-16.92%
jan 1, 1988
13.946
-1.332
-8.72%
jan 1, 1989
12.608
-1.339
-9.6%
jan 1, 1990
10.08
-2.527
-20.05%
jan 1, 1991
10.311
+0.23
2.28%
jan 1, 1992
12.009
+1.699
16.48%
jan 1, 1993
11.684
-0.325
-2.71%
jan 1, 1994
13.668
+1.984
16.98%
jan 1, 1995
14.539
+0.871
6.37%
jan 1, 1996
14.757
+0.219
1.5%
jan 1, 1997
11.644
-3.114
-21.1%
jan 1, 1998
10.606
-1.038
-8.91%
jan 1, 1999
21.591
+10.985
103.58%
jan 1, 2000
23.269
+1.679
7.77%
jan 1, 2001
24.993
+1.724
7.41%
jan 1, 2002
24.05
-0.944
-3.78%
jan 1, 2003
25.199
+1.149
4.78%
jan 1, 2004
24.427
-0.772
-3.06%
jan 1, 2005
20.727
-3.701
-15.15%
jan 1, 2006
19.286
-1.441
-6.95%
jan 1, 2007
17.204
-2.082
-10.79%
jan 1, 2008
18.317
+1.113
6.47%
jan 1, 2009
12.188
-6.129
-33.46%
jan 1, 2010
12.343
+0.155
1.27%
jan 1, 2011
11.632
-0.711
-5.76%
jan 1, 2012
11.867
+0.236
2.03%
jan 1, 2013
10.982
-0.885
-7.46%
jan 1, 2014
10.001
-0.982
-8.94%
jan 1, 2015
14.05
+4.05
40.49%
jan 1, 2016
12.35
-1.701
-12.1%
Ranking of countries by current statistics by years


Comments: