29
/
en
AIzaSyAYiBZKx7MnpbEhh9jyipgxe19OcubqV5w
April 1, 2024
238838
Seychelles
SYC
true
2
1
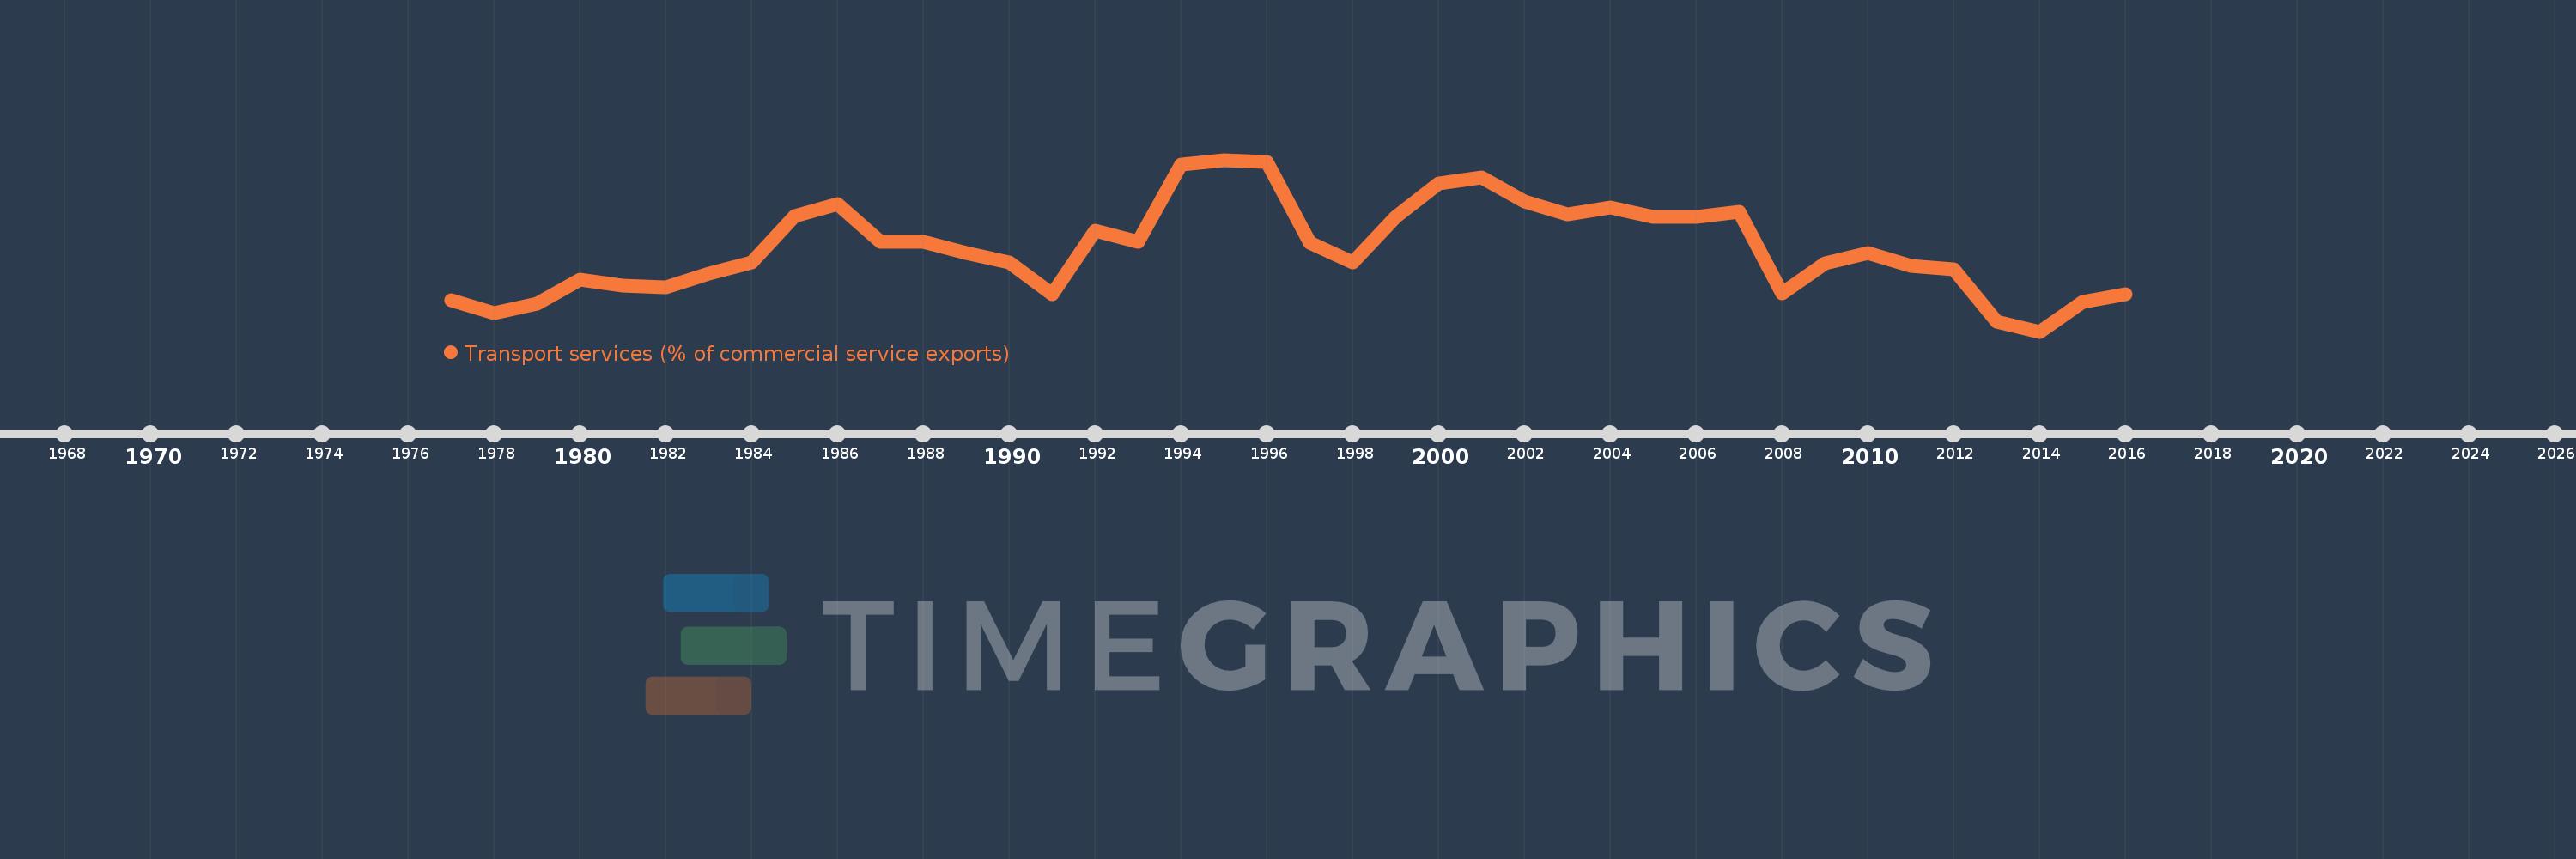
Transport services (% of commercial service exports)
2016,2015,2014,2013,2012,2011,2010,2009,2008,2007,2006,2005,2004,2003,2002,2001,2000,1999,1998,1997,1996,1995,1994,1993,1992,1991,1990,1989,1988,1987,1986,1985,1984,1983,1982,1981,1980,1979,1978,1977
This statistics in other country:
AfghanistanAlbaniaAlgeriaAngolaAntigua and BarbudaArab WorldArgentinaArmeniaArubaAustraliaAustriaAzerbaijanBahamas, TheBahrainBangladeshBarbadosBelarusBelgiumBelizeBeninBermudaBhutanBoliviaBosnia and HerzegovinaBotswanaBrazilBrunei DarussalamBulgariaBurkina FasoBurundiCabo VerdeCambodiaCameroonCanadaCaribbean small statesCentral African RepublicCentral Europe and the BalticsChadChileChinaColombiaComorosCongo, Dem. Rep.Congo, Rep.Costa RicaCote d'IvoireCroatiaCuracaoCyprusCzech RepublicDenmarkDjiboutiDominicaDominican RepublicEarly-demographic dividendEast Asia & PacificEast Asia & Pacific (excluding high income)East Asia & Pacific (IDA & IBRD countries)EcuadorEgypt, Arab Rep.El SalvadorEritreaEstoniaEthiopiaEuro areaEurope & Central AsiaEurope & Central Asia (excluding high income)Europe & Central Asia (IDA & IBRD countries)European UnionFaroe IslandsFijiFinlandFragile and conflict affected situationsFranceFrench PolynesiaGabonGambia, TheGeorgiaGermanyGhanaGreeceGrenadaGuatemalaGuineaGuinea-BissauGuyanaHaitiHeavily indebted poor countries (HIPC)High incomeHondurasHong Kong SAR, ChinaHungaryIBRD onlyIcelandIDA & IBRD totalIDA onlyIDA totalIndiaIndonesiaIran, Islamic Rep.IraqIrelandIsraelItalyJamaicaJapanJordanKazakhstanKenyaKiribatiKorea, Rep.KosovoKuwaitKyrgyz RepublicLao PDRLate-demographic dividendLatin America & Caribbean Latin America & Caribbean (excluding high income)Latin America & the Caribbean (IDA & IBRD countries)LatviaLeast developed countries: UN classificationLebanonLesothoLiberiaLibyaLithuaniaLow & middle incomeLow incomeLower middle incomeLuxembourgMacao SAR, ChinaMacedonia, FYRMadagascarMalawiMalaysiaMaldivesMaliMaltaMarshall IslandsMauritaniaMauritiusMexicoMicronesia, Fed. Sts.Middle East & North AfricaMiddle East & North Africa (excluding high income)Middle East & North Africa (IDA & IBRD countries)Middle incomeMoldovaMongoliaMontenegroMoroccoMozambiqueMyanmarNamibiaNepalNetherlandsNew CaledoniaNew ZealandNicaraguaNigerNigeriaNorth AmericaNorwayOECD membersOmanOther small statesPacific island small statesPakistanPalauPanamaPapua New GuineaParaguayPeruPhilippinesPolandPortugalPost-demographic dividendPre-demographic dividendQatarRomaniaRussian FederationRwandaSamoaSao Tome and PrincipeSaudi ArabiaSenegalSerbiaSeychellesSierra LeoneSingaporeSint Maarten (Dutch part)Slovak RepublicSloveniaSmall statesSolomon IslandsSouth AfricaSouth AsiaSouth Asia (IDA & IBRD)South SudanSpainSri LankaSt. Kitts and NevisSt. LuciaSt. Vincent and the GrenadinesSub-Saharan Africa Sub-Saharan Africa (excluding high income)Sub-Saharan Africa (IDA & IBRD countries)SudanSurinameSwazilandSwedenSwitzerlandSyrian Arab RepublicTajikistanTanzaniaThailandTimor-LesteTogoTongaTrinidad and TobagoTunisiaTurkeyTuvaluUgandaUkraineUnited KingdomUnited StatesUpper middle incomeUruguayVanuatuVenezuela, RBWest Bank and GazaWorldYemen, Rep.ZambiaZimbabwe Timeline:
This timeline shows a graph from 1977 to 2016 of Seychelles. No data until 1976. Number of actual observations by date: 40.
Source name:
World Development Indicators
Source organization:
International Monetary Fund, Balance of Payments Statistics Yearbook and data files.
Categories, topics:
Private Sector, Trade
Last updated:
apr 23, 2017
Indicators value changes by year
Minimum:
18.176
jan 1, 2014
Maximum:
48.323
jan 1, 1995
At the date of observation
Value
Absolute change
Change from previous value
jan 1, 1977
23.62
+23.62
0.0%
jan 1, 1978
21.422
-2.198
-9.3%
jan 1, 1979
23.086
+1.664
7.77%
jan 1, 1980
27.26
+4.174
18.08%
jan 1, 1981
26.311
-0.949
-3.48%
jan 1, 1982
25.929
-0.382
-1.45%
jan 1, 1983
28.315
+2.386
9.2%
jan 1, 1984
30.295
+1.98
6.99%
jan 1, 1985
38.513
+8.218
27.13%
jan 1, 1986
40.635
+2.123
5.51%
jan 1, 1987
33.985
-6.651
-16.37%
jan 1, 1988
33.855
-0.13
-0.38%
jan 1, 1989
31.911
-1.944
-5.74%
jan 1, 1990
30.264
-1.646
-5.16%
jan 1, 1991
24.689
-5.575
-18.42%
jan 1, 1992
35.937
+11.247
45.55%
jan 1, 1993
33.961
-1.976
-5.5%
jan 1, 1994
47.553
+13.593
40.02%
jan 1, 1995
48.323
+0.77
1.62%
jan 1, 1996
48.017
-0.305
-0.63%
jan 1, 1997
33.822
-14.196
-29.56%
jan 1, 1998
30.369
-3.452
-10.21%
jan 1, 1999
38.257
+7.888
25.97%
jan 1, 2000
44.229
+5.972
15.61%
jan 1, 2001
45.194
+0.965
2.18%
jan 1, 2002
41.006
-4.188
-9.27%
jan 1, 2003
38.758
-2.248
-5.48%
jan 1, 2004
40.026
+1.268
3.27%
jan 1, 2005
38.239
-1.787
-4.46%
jan 1, 2006
38.362
+0.123
0.32%
jan 1, 2007
39.196
+0.835
2.18%
jan 1, 2008
24.949
-14.247
-36.35%
jan 1, 2009
30.171
+5.223
20.93%
jan 1, 2010
32.002
+1.831
6.07%
jan 1, 2011
29.739
-2.263
-7.07%
jan 1, 2012
29.109
-0.63
-2.12%
jan 1, 2013
19.93
-9.179
-31.53%
jan 1, 2014
18.176
-1.754
-8.8%
jan 1, 2015
23.372
+5.196
28.59%
jan 1, 2016
24.733
+1.361
5.82%
Ranking of countries by current statistics by years


Comments: