29
/
en
AIzaSyAYiBZKx7MnpbEhh9jyipgxe19OcubqV5w
April 1, 2024
163383
Jamaica
JAM
true
2
1
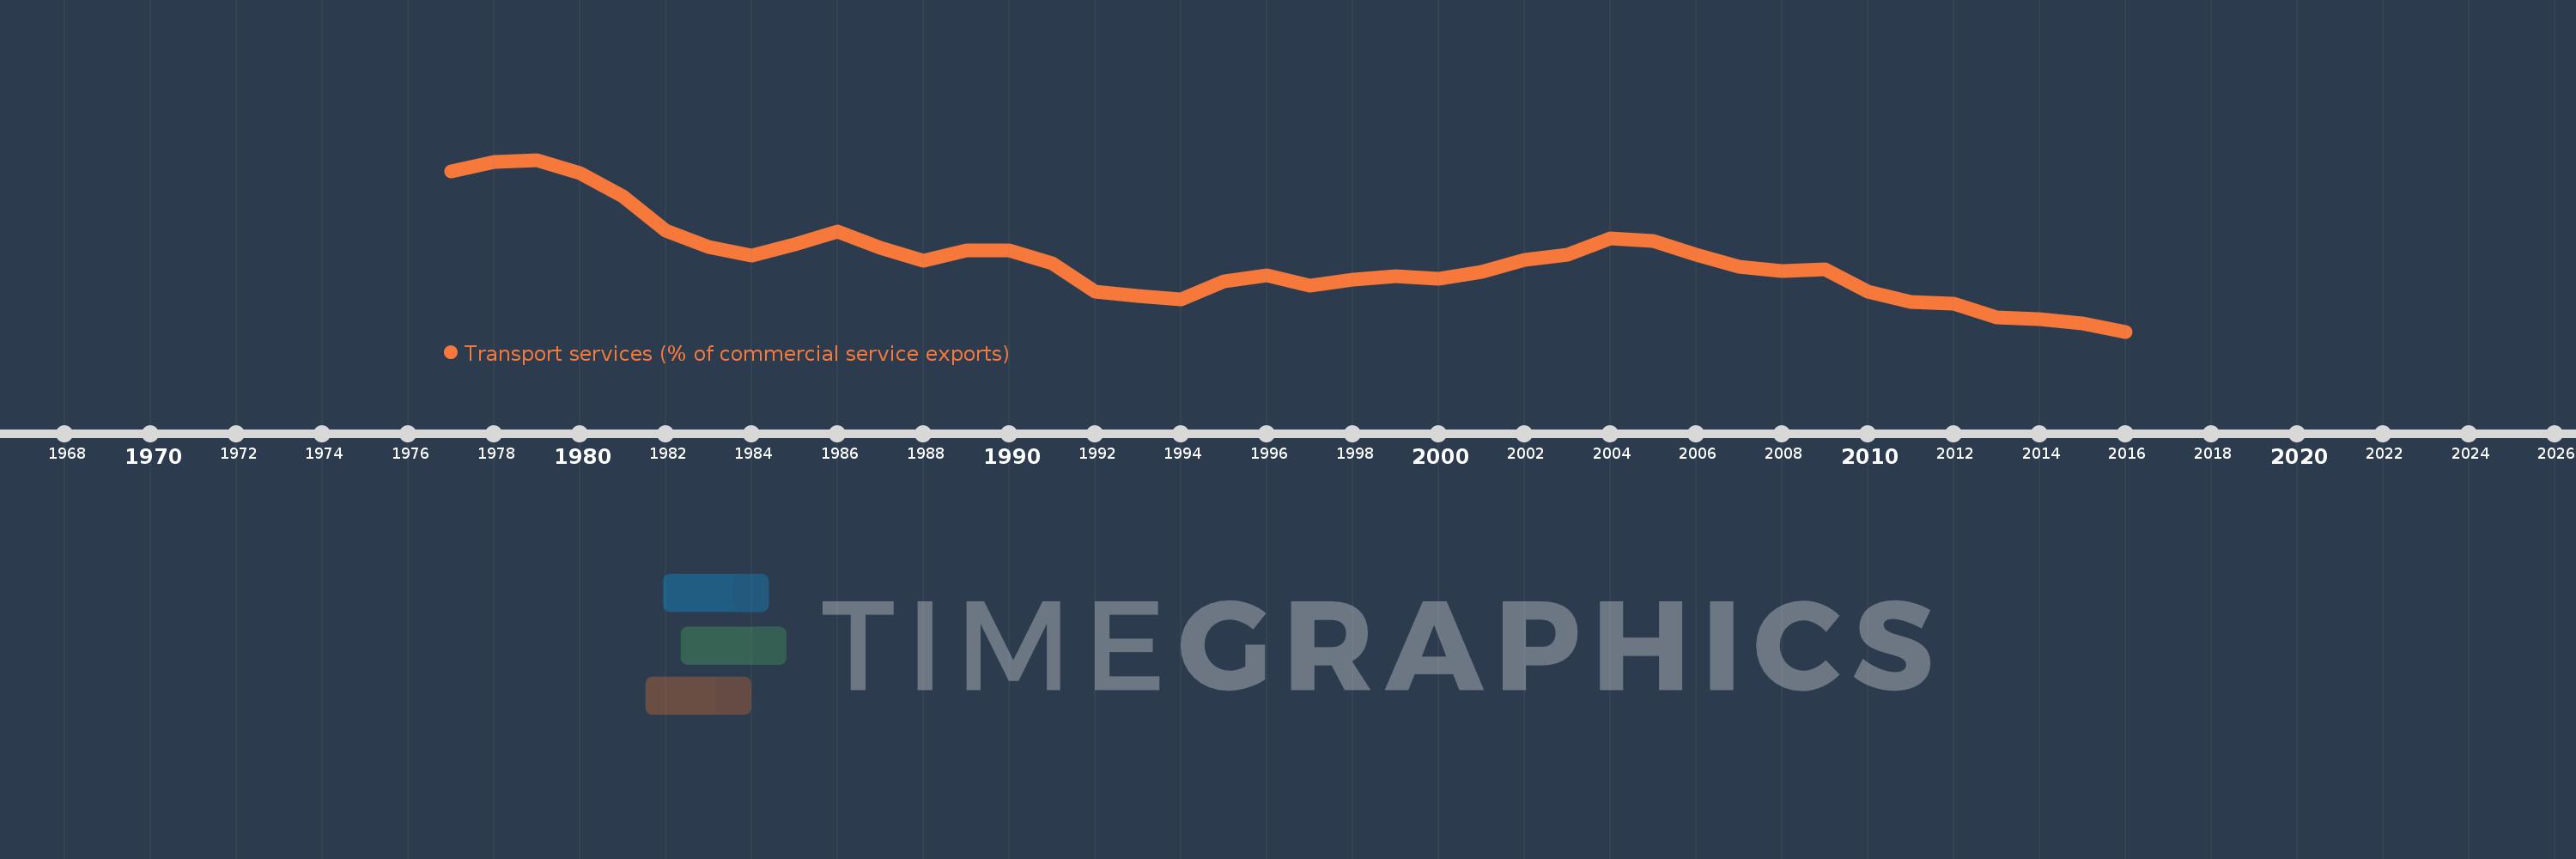
Transport services (% of commercial service exports)
2016,2015,2014,2013,2012,2011,2010,2009,2008,2007,2006,2005,2004,2003,2002,2001,2000,1999,1998,1997,1996,1995,1994,1993,1992,1991,1990,1989,1988,1987,1986,1985,1984,1983,1982,1981,1980,1979,1978,1977
This statistics in other country:
AfghanistanAlbaniaAlgeriaAngolaAntigua and BarbudaArab WorldArgentinaArmeniaArubaAustraliaAustriaAzerbaijanBahamas, TheBahrainBangladeshBarbadosBelarusBelgiumBelizeBeninBermudaBhutanBoliviaBosnia and HerzegovinaBotswanaBrazilBrunei DarussalamBulgariaBurkina FasoBurundiCabo VerdeCambodiaCameroonCanadaCaribbean small statesCentral African RepublicCentral Europe and the BalticsChadChileChinaColombiaComorosCongo, Dem. Rep.Congo, Rep.Costa RicaCote d'IvoireCroatiaCuracaoCyprusCzech RepublicDenmarkDjiboutiDominicaDominican RepublicEarly-demographic dividendEast Asia & PacificEast Asia & Pacific (excluding high income)East Asia & Pacific (IDA & IBRD countries)EcuadorEgypt, Arab Rep.El SalvadorEritreaEstoniaEthiopiaEuro areaEurope & Central AsiaEurope & Central Asia (excluding high income)Europe & Central Asia (IDA & IBRD countries)European UnionFaroe IslandsFijiFinlandFragile and conflict affected situationsFranceFrench PolynesiaGabonGambia, TheGeorgiaGermanyGhanaGreeceGrenadaGuatemalaGuineaGuinea-BissauGuyanaHaitiHeavily indebted poor countries (HIPC)High incomeHondurasHong Kong SAR, ChinaHungaryIBRD onlyIcelandIDA & IBRD totalIDA onlyIDA totalIndiaIndonesiaIran, Islamic Rep.IraqIrelandIsraelItalyJamaicaJapanJordanKazakhstanKenyaKiribatiKorea, Rep.KosovoKuwaitKyrgyz RepublicLao PDRLate-demographic dividendLatin America & Caribbean Latin America & Caribbean (excluding high income)Latin America & the Caribbean (IDA & IBRD countries)LatviaLeast developed countries: UN classificationLebanonLesothoLiberiaLibyaLithuaniaLow & middle incomeLow incomeLower middle incomeLuxembourgMacao SAR, ChinaMacedonia, FYRMadagascarMalawiMalaysiaMaldivesMaliMaltaMarshall IslandsMauritaniaMauritiusMexicoMicronesia, Fed. Sts.Middle East & North AfricaMiddle East & North Africa (excluding high income)Middle East & North Africa (IDA & IBRD countries)Middle incomeMoldovaMongoliaMontenegroMoroccoMozambiqueMyanmarNamibiaNepalNetherlandsNew CaledoniaNew ZealandNicaraguaNigerNigeriaNorth AmericaNorwayOECD membersOmanOther small statesPacific island small statesPakistanPalauPanamaPapua New GuineaParaguayPeruPhilippinesPolandPortugalPost-demographic dividendPre-demographic dividendQatarRomaniaRussian FederationRwandaSamoaSao Tome and PrincipeSaudi ArabiaSenegalSerbiaSeychellesSierra LeoneSingaporeSint Maarten (Dutch part)Slovak RepublicSloveniaSmall statesSolomon IslandsSouth AfricaSouth AsiaSouth Asia (IDA & IBRD)South SudanSpainSri LankaSt. Kitts and NevisSt. LuciaSt. Vincent and the GrenadinesSub-Saharan Africa Sub-Saharan Africa (excluding high income)Sub-Saharan Africa (IDA & IBRD countries)SudanSurinameSwazilandSwedenSwitzerlandSyrian Arab RepublicTajikistanTanzaniaThailandTimor-LesteTogoTongaTrinidad and TobagoTunisiaTurkeyTuvaluUgandaUkraineUnited KingdomUnited StatesUpper middle incomeUruguayVanuatuVenezuela, RBWest Bank and GazaWorldYemen, Rep.ZambiaZimbabwe Timeline:
This timeline shows a graph from 1977 to 2016 of Jamaica. No data until 1976. Number of actual observations by date: 40.
Source name:
World Development Indicators
Source organization:
International Monetary Fund, Balance of Payments Statistics Yearbook and data files.
Categories, topics:
Private Sector, Trade
Last updated:
apr 23, 2017
Indicators value changes by year
Maximum:
36.317
jan 1, 1979
At the date of observation
Value
Absolute change
Change from previous value
jan 1, 1977
34.223
+34.223
0.0%
jan 1, 1978
35.921
+1.698
4.96%
jan 1, 1979
36.317
+0.396
1.1%
jan 1, 1980
33.92
-2.397
-6.6%
jan 1, 1981
29.872
-4.048
-11.93%
jan 1, 1982
23.916
-5.956
-19.94%
jan 1, 1983
20.931
-2.985
-12.48%
jan 1, 1984
19.494
-1.437
-6.86%
jan 1, 1985
21.425
+1.931
9.9%
jan 1, 1986
23.634
+2.209
10.31%
jan 1, 1987
20.798
-2.836
-12.0%
jan 1, 1988
18.49
-2.308
-11.1%
jan 1, 1989
20.383
+1.893
10.24%
jan 1, 1990
20.333
-0.05
-0.25%
jan 1, 1991
18.027
-2.306
-11.34%
jan 1, 1992
13.072
-4.954
-27.48%
jan 1, 1993
12.403
-0.669
-5.12%
jan 1, 1994
11.775
-0.629
-5.07%
jan 1, 1995
14.862
+3.088
26.22%
jan 1, 1996
16.005
+1.143
7.69%
jan 1, 1997
14.185
-1.82
-11.37%
jan 1, 1998
15.199
+1.014
7.15%
jan 1, 1999
15.836
+0.636
4.19%
jan 1, 2000
15.406
-0.429
-2.71%
jan 1, 2001
16.528
+1.122
7.28%
jan 1, 2002
18.77
+2.242
13.57%
jan 1, 2003
19.602
+0.832
4.43%
jan 1, 2004
22.555
+2.953
15.06%
jan 1, 2005
21.982
-0.573
-2.54%
jan 1, 2006
19.65
-2.332
-10.61%
jan 1, 2007
17.561
-2.089
-10.63%
jan 1, 2008
16.75
-0.811
-4.62%
jan 1, 2009
16.974
+0.223
1.33%
jan 1, 2010
13.159
-3.815
-22.48%
jan 1, 2011
11.352
-1.807
-13.73%
jan 1, 2012
10.959
-0.393
-3.46%
jan 1, 2013
8.601
-2.357
-21.51%
jan 1, 2014
8.344
-0.258
-3.0%
jan 1, 2015
7.472
-0.872
-10.45%
jan 1, 2016
6.08
-1.392
-18.62%
Ranking of countries by current statistics by years


Comments: