29
/
en
AIzaSyAYiBZKx7MnpbEhh9jyipgxe19OcubqV5w
April 1, 2024
256926
Sweden
SWE
true
2
1
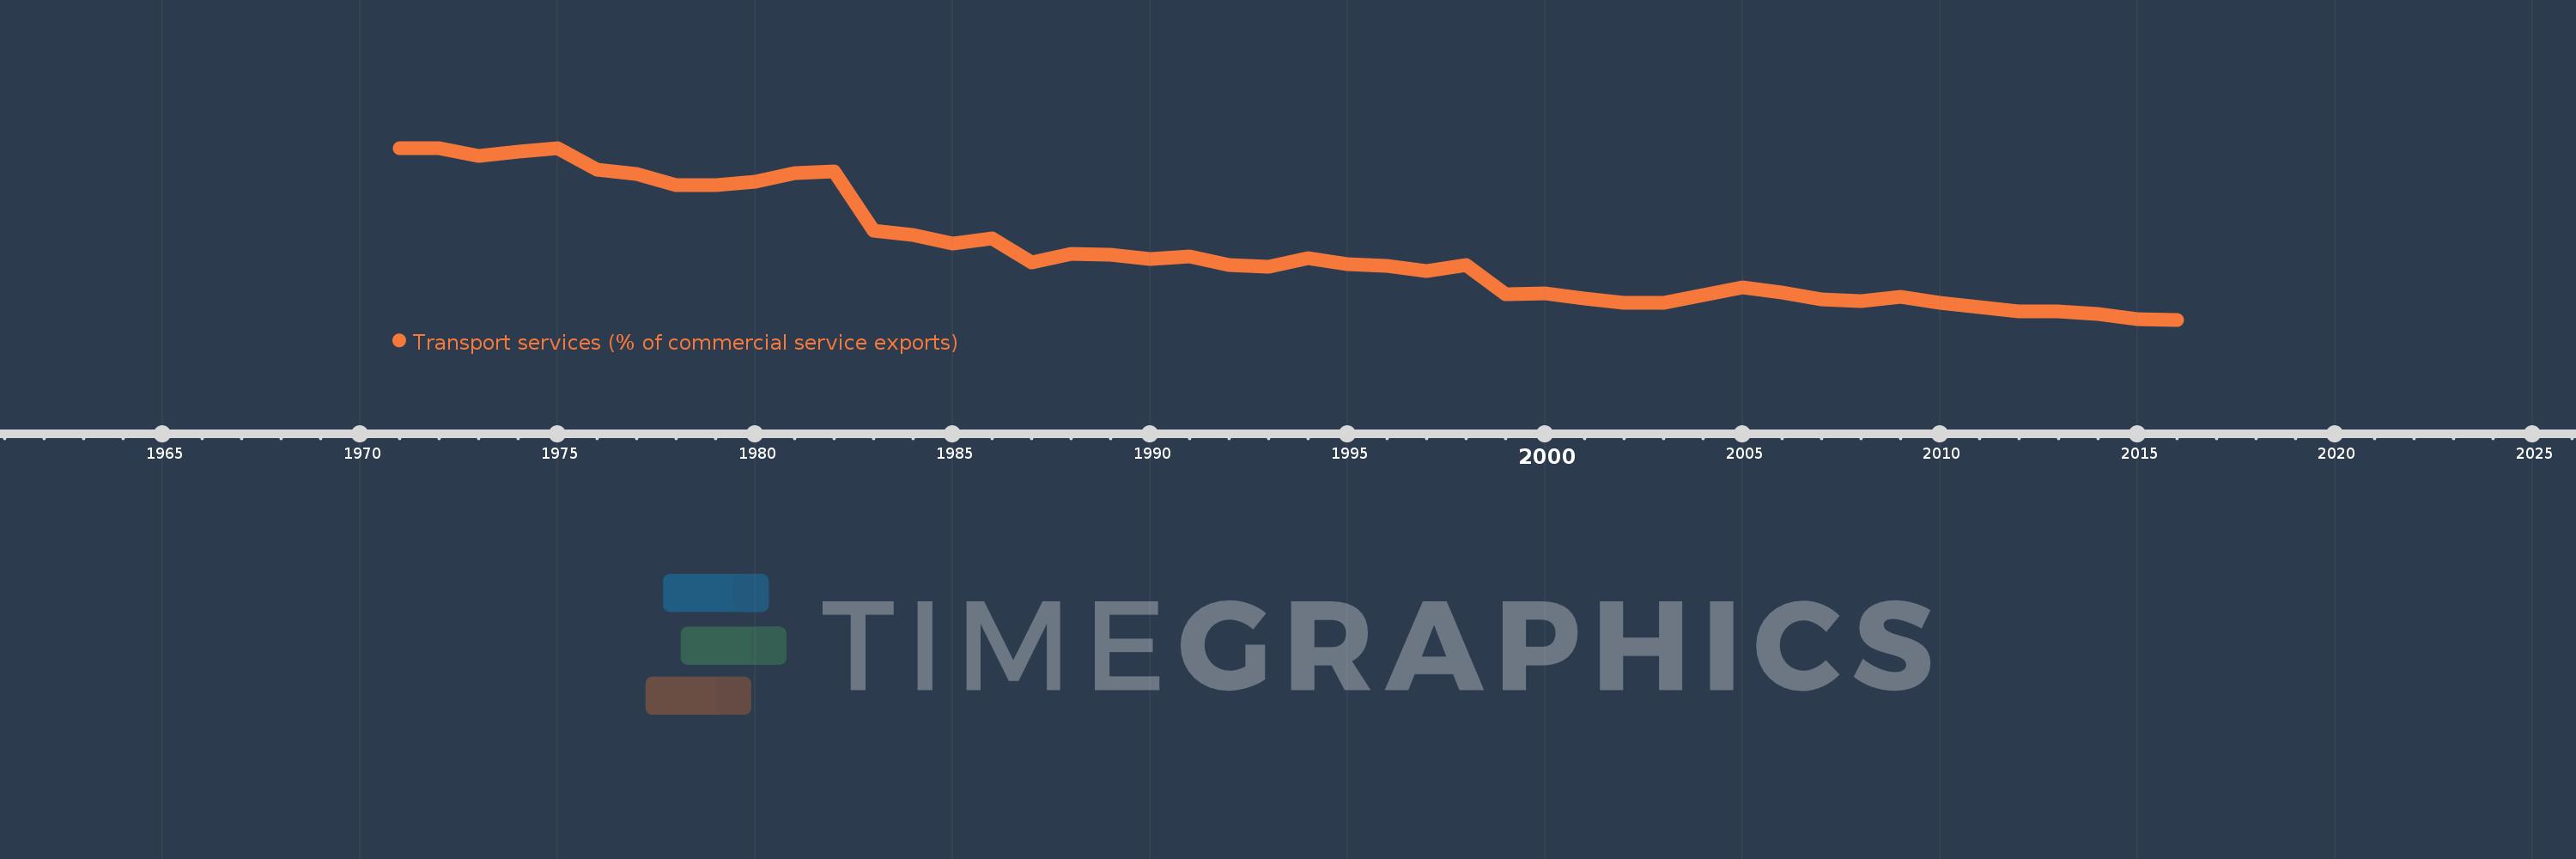
Transport services (% of commercial service exports)
2016,2015,2014,2013,2012,2011,2010,2009,2008,2007,2006,2005,2004,2003,2002,2001,2000,1999,1998,1997,1996,1995,1994,1993,1992,1991,1990,1989,1988,1987,1986,1985,1984,1983,1982,1981,1980,1979,1978,1977,1976,1975,1974,1973,1972,1971
This statistics in other country:
AfghanistanAlbaniaAlgeriaAngolaAntigua and BarbudaArab WorldArgentinaArmeniaArubaAustraliaAustriaAzerbaijanBahamas, TheBahrainBangladeshBarbadosBelarusBelgiumBelizeBeninBermudaBhutanBoliviaBosnia and HerzegovinaBotswanaBrazilBrunei DarussalamBulgariaBurkina FasoBurundiCabo VerdeCambodiaCameroonCanadaCaribbean small statesCentral African RepublicCentral Europe and the BalticsChadChileChinaColombiaComorosCongo, Dem. Rep.Congo, Rep.Costa RicaCote d'IvoireCroatiaCuracaoCyprusCzech RepublicDenmarkDjiboutiDominicaDominican RepublicEarly-demographic dividendEast Asia & PacificEast Asia & Pacific (excluding high income)East Asia & Pacific (IDA & IBRD countries)EcuadorEgypt, Arab Rep.El SalvadorEritreaEstoniaEthiopiaEuro areaEurope & Central AsiaEurope & Central Asia (excluding high income)Europe & Central Asia (IDA & IBRD countries)European UnionFaroe IslandsFijiFinlandFragile and conflict affected situationsFranceFrench PolynesiaGabonGambia, TheGeorgiaGermanyGhanaGreeceGrenadaGuatemalaGuineaGuinea-BissauGuyanaHaitiHeavily indebted poor countries (HIPC)High incomeHondurasHong Kong SAR, ChinaHungaryIBRD onlyIcelandIDA & IBRD totalIDA onlyIDA totalIndiaIndonesiaIran, Islamic Rep.IraqIrelandIsraelItalyJamaicaJapanJordanKazakhstanKenyaKiribatiKorea, Rep.KosovoKuwaitKyrgyz RepublicLao PDRLate-demographic dividendLatin America & Caribbean Latin America & Caribbean (excluding high income)Latin America & the Caribbean (IDA & IBRD countries)LatviaLeast developed countries: UN classificationLebanonLesothoLiberiaLibyaLithuaniaLow & middle incomeLow incomeLower middle incomeLuxembourgMacao SAR, ChinaMacedonia, FYRMadagascarMalawiMalaysiaMaldivesMaliMaltaMarshall IslandsMauritaniaMauritiusMexicoMicronesia, Fed. Sts.Middle East & North AfricaMiddle East & North Africa (excluding high income)Middle East & North Africa (IDA & IBRD countries)Middle incomeMoldovaMongoliaMontenegroMoroccoMozambiqueMyanmarNamibiaNepalNetherlandsNew CaledoniaNew ZealandNicaraguaNigerNigeriaNorth AmericaNorwayOECD membersOmanOther small statesPacific island small statesPakistanPalauPanamaPapua New GuineaParaguayPeruPhilippinesPolandPortugalPost-demographic dividendPre-demographic dividendQatarRomaniaRussian FederationRwandaSamoaSao Tome and PrincipeSaudi ArabiaSenegalSerbiaSeychellesSierra LeoneSingaporeSint Maarten (Dutch part)Slovak RepublicSloveniaSmall statesSolomon IslandsSouth AfricaSouth AsiaSouth Asia (IDA & IBRD)South SudanSpainSri LankaSt. Kitts and NevisSt. LuciaSt. Vincent and the GrenadinesSub-Saharan Africa Sub-Saharan Africa (excluding high income)Sub-Saharan Africa (IDA & IBRD countries)SudanSurinameSwazilandSwedenSwitzerlandSyrian Arab RepublicTajikistanTanzaniaThailandTimor-LesteTogoTongaTrinidad and TobagoTunisiaTurkeyTuvaluUgandaUkraineUnited KingdomUnited StatesUpper middle incomeUruguayVanuatuVenezuela, RBWest Bank and GazaWorldYemen, Rep.ZambiaZimbabwe Timeline:
This timeline shows a graph from 1971 to 2016 of Sweden. No data until 1970. Number of actual observations by date: 46.
Source name:
World Development Indicators
Source organization:
International Monetary Fund, Balance of Payments Statistics Yearbook and data files.
Categories, topics:
Private Sector, Trade
Last updated:
apr 23, 2017
Indicators value changes by year
Maximum:
70.576
jan 1, 1975
At the date of observation
Value
Absolute change
Change from previous value
jan 1, 1971
70.425
+70.425
0.0%
jan 1, 1972
70.553
+0.128
0.18%
jan 1, 1973
68.182
-2.371
-3.36%
jan 1, 1974
69.398
+1.216
1.78%
jan 1, 1975
70.576
+1.178
1.7%
jan 1, 1976
63.698
-6.878
-9.75%
jan 1, 1977
62.243
-1.455
-2.28%
jan 1, 1978
58.875
-3.367
-5.41%
jan 1, 1979
58.71
-0.165
-0.28%
jan 1, 1980
59.929
+1.218
2.08%
jan 1, 1981
62.661
+2.732
4.56%
jan 1, 1982
63.144
+0.483
0.77%
jan 1, 1983
44.354
-18.79
-29.76%
jan 1, 1984
43.107
-1.247
-2.81%
jan 1, 1985
40.327
-2.78
-6.45%
jan 1, 1986
41.904
+1.578
3.91%
jan 1, 1987
34.57
-7.334
-17.5%
jan 1, 1988
37.042
+2.471
7.15%
jan 1, 1989
36.93
-0.111
-0.3%
jan 1, 1990
35.455
-1.475
-3.99%
jan 1, 1991
36.35
+0.895
2.52%
jan 1, 1992
33.724
-2.627
-7.23%
jan 1, 1993
33.093
-0.63
-1.87%
jan 1, 1994
35.938
+2.844
8.59%
jan 1, 1995
34.039
-1.898
-5.28%
jan 1, 1996
33.495
-0.545
-1.6%
jan 1, 1997
31.646
-1.848
-5.52%
jan 1, 1998
33.671
+2.025
6.4%
jan 1, 1999
24.437
-9.234
-27.43%
jan 1, 2000
24.653
+0.216
0.88%
jan 1, 2001
23.115
-1.538
-6.24%
jan 1, 2002
21.623
-1.492
-6.45%
jan 1, 2003
21.629
+0.005
0.02%
jan 1, 2004
24.183
+2.554
11.81%
jan 1, 2005
26.616
+2.433
10.06%
jan 1, 2006
24.841
-1.775
-6.67%
jan 1, 2007
22.745
-2.096
-8.44%
jan 1, 2008
22.267
-0.478
-2.1%
jan 1, 2009
23.709
+1.441
6.47%
jan 1, 2010
21.679
-2.03
-8.56%
jan 1, 2011
20.241
-1.438
-6.63%
jan 1, 2012
19.006
-1.234
-6.1%
jan 1, 2013
18.992
-0.014
-0.07%
jan 1, 2014
18.285
-0.707
-3.72%
jan 1, 2015
16.534
-1.751
-9.58%
jan 1, 2016
16.37
-0.164
-0.99%
Ranking of countries by current statistics by years


Comments: