29
/
en
AIzaSyAYiBZKx7MnpbEhh9jyipgxe19OcubqV5w
April 1, 2024
231839
Rwanda
RWA
true
2
1
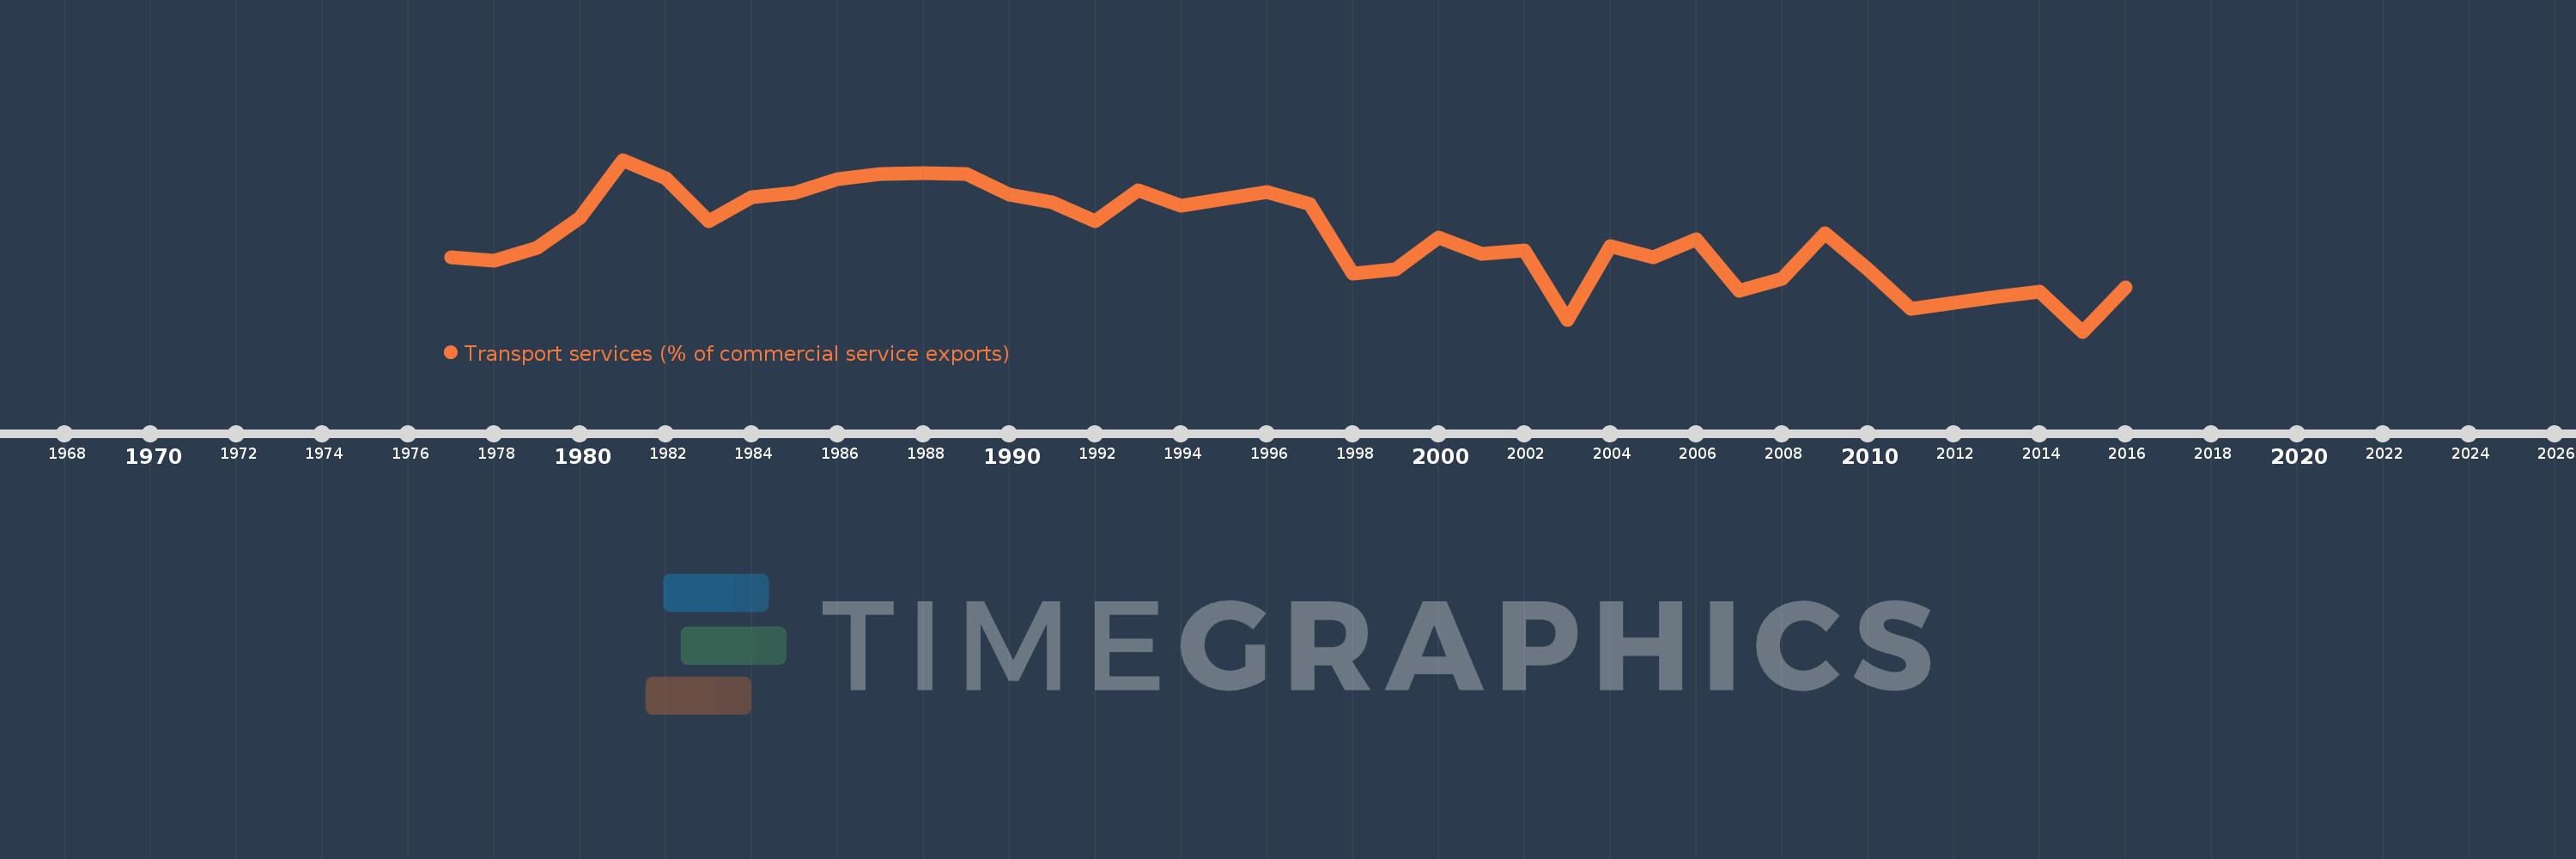
Transport services (% of commercial service exports)
2016,2015,2014,2013,2012,2011,2010,2009,2008,2007,2006,2005,2004,2003,2002,2001,2000,1999,1998,1997,1996,1994,1993,1992,1991,1990,1989,1988,1987,1986,1985,1984,1983,1982,1981,1980,1979,1978,1977
This statistics in other country:
AfghanistanAlbaniaAlgeriaAngolaAntigua and BarbudaArab WorldArgentinaArmeniaArubaAustraliaAustriaAzerbaijanBahamas, TheBahrainBangladeshBarbadosBelarusBelgiumBelizeBeninBermudaBhutanBoliviaBosnia and HerzegovinaBotswanaBrazilBrunei DarussalamBulgariaBurkina FasoBurundiCabo VerdeCambodiaCameroonCanadaCaribbean small statesCentral African RepublicCentral Europe and the BalticsChadChileChinaColombiaComorosCongo, Dem. Rep.Congo, Rep.Costa RicaCote d'IvoireCroatiaCuracaoCyprusCzech RepublicDenmarkDjiboutiDominicaDominican RepublicEarly-demographic dividendEast Asia & PacificEast Asia & Pacific (excluding high income)East Asia & Pacific (IDA & IBRD countries)EcuadorEgypt, Arab Rep.El SalvadorEritreaEstoniaEthiopiaEuro areaEurope & Central AsiaEurope & Central Asia (excluding high income)Europe & Central Asia (IDA & IBRD countries)European UnionFaroe IslandsFijiFinlandFragile and conflict affected situationsFranceFrench PolynesiaGabonGambia, TheGeorgiaGermanyGhanaGreeceGrenadaGuatemalaGuineaGuinea-BissauGuyanaHaitiHeavily indebted poor countries (HIPC)High incomeHondurasHong Kong SAR, ChinaHungaryIBRD onlyIcelandIDA & IBRD totalIDA onlyIDA totalIndiaIndonesiaIran, Islamic Rep.IraqIrelandIsraelItalyJamaicaJapanJordanKazakhstanKenyaKiribatiKorea, Rep.KosovoKuwaitKyrgyz RepublicLao PDRLate-demographic dividendLatin America & Caribbean Latin America & Caribbean (excluding high income)Latin America & the Caribbean (IDA & IBRD countries)LatviaLeast developed countries: UN classificationLebanonLesothoLiberiaLibyaLithuaniaLow & middle incomeLow incomeLower middle incomeLuxembourgMacao SAR, ChinaMacedonia, FYRMadagascarMalawiMalaysiaMaldivesMaliMaltaMarshall IslandsMauritaniaMauritiusMexicoMicronesia, Fed. Sts.Middle East & North AfricaMiddle East & North Africa (excluding high income)Middle East & North Africa (IDA & IBRD countries)Middle incomeMoldovaMongoliaMontenegroMoroccoMozambiqueMyanmarNamibiaNepalNetherlandsNew CaledoniaNew ZealandNicaraguaNigerNigeriaNorth AmericaNorwayOECD membersOmanOther small statesPacific island small statesPakistanPalauPanamaPapua New GuineaParaguayPeruPhilippinesPolandPortugalPost-demographic dividendPre-demographic dividendQatarRomaniaRussian FederationRwandaSamoaSao Tome and PrincipeSaudi ArabiaSenegalSerbiaSeychellesSierra LeoneSingaporeSint Maarten (Dutch part)Slovak RepublicSloveniaSmall statesSolomon IslandsSouth AfricaSouth AsiaSouth Asia (IDA & IBRD)South SudanSpainSri LankaSt. Kitts and NevisSt. LuciaSt. Vincent and the GrenadinesSub-Saharan Africa Sub-Saharan Africa (excluding high income)Sub-Saharan Africa (IDA & IBRD countries)SudanSurinameSwazilandSwedenSwitzerlandSyrian Arab RepublicTajikistanTanzaniaThailandTimor-LesteTogoTongaTrinidad and TobagoTunisiaTurkeyTuvaluUgandaUkraineUnited KingdomUnited StatesUpper middle incomeUruguayVanuatuVenezuela, RBWest Bank and GazaWorldYemen, Rep.ZambiaZimbabwe Timeline:
This timeline shows a graph from 1977 to 2016 of Rwanda. No data until 1976. Number of actual observations by date: 39.
Source name:
World Development Indicators
Source organization:
International Monetary Fund, Balance of Payments Statistics Yearbook and data files.
Categories, topics:
Private Sector, Trade
Last updated:
apr 23, 2017
Indicators value changes by year
Maximum:
74.213
jan 1, 1981
At the date of observation
Value
Absolute change
Change from previous value
jan 1, 1977
33.162
+33.162
0.0%
jan 1, 1978
31.783
-1.379
-4.16%
jan 1, 1979
36.965
+5.182
16.3%
jan 1, 1980
49.772
+12.807
34.65%
jan 1, 1981
74.213
+24.441
49.1%
jan 1, 1982
66.48
-7.733
-10.42%
jan 1, 1983
48.194
-18.286
-27.51%
jan 1, 1984
58.445
+10.251
21.27%
jan 1, 1985
60.336
+1.891
3.23%
jan 1, 1986
66.174
+5.838
9.68%
jan 1, 1987
68.341
+2.167
3.27%
jan 1, 1988
68.716
+0.376
0.55%
jan 1, 1989
68.142
-0.575
-0.84%
jan 1, 1990
59.676
-8.466
-12.42%
jan 1, 1991
56.119
-3.557
-5.96%
jan 1, 1992
48.303
-7.817
-13.93%
jan 1, 1993
61.38
+13.077
27.07%
jan 1, 1994
54.866
-6.514
-10.61%
jan 1, 1996
60.553
+5.687
10.36%
jan 1, 1997
55.578
-4.975
-8.22%
jan 1, 1998
26.392
-29.186
-52.51%
jan 1, 1999
28.18
+1.788
6.77%
jan 1, 2000
41.477
+13.297
47.19%
jan 1, 2001
34.479
-6.998
-16.87%
jan 1, 2002
36.03
+1.551
4.5%
jan 1, 2003
6.647
-29.383
-81.55%
jan 1, 2004
37.941
+31.294
470.83%
jan 1, 2005
33.015
-4.926
-12.98%
jan 1, 2006
40.584
+7.569
22.92%
jan 1, 2007
19.099
-21.485
-52.94%
jan 1, 2008
24.167
+5.068
26.54%
jan 1, 2009
43.333
+19.166
79.31%
jan 1, 2010
28.115
-15.218
-35.12%
jan 1, 2011
11.357
-16.758
-59.61%
jan 1, 2012
13.782
+2.426
21.36%
jan 1, 2013
16.388
+2.606
18.91%
jan 1, 2014
18.449
+2.061
12.58%
jan 1, 2015
1.76
-16.689
-90.46%
jan 1, 2016
20.329
+18.569
1.05K%
Ranking of countries by current statistics by years


Comments: