29
/
en
AIzaSyAYiBZKx7MnpbEhh9jyipgxe19OcubqV5w
April 1, 2024
270917
Turkmenistan
TKM
true
2
1
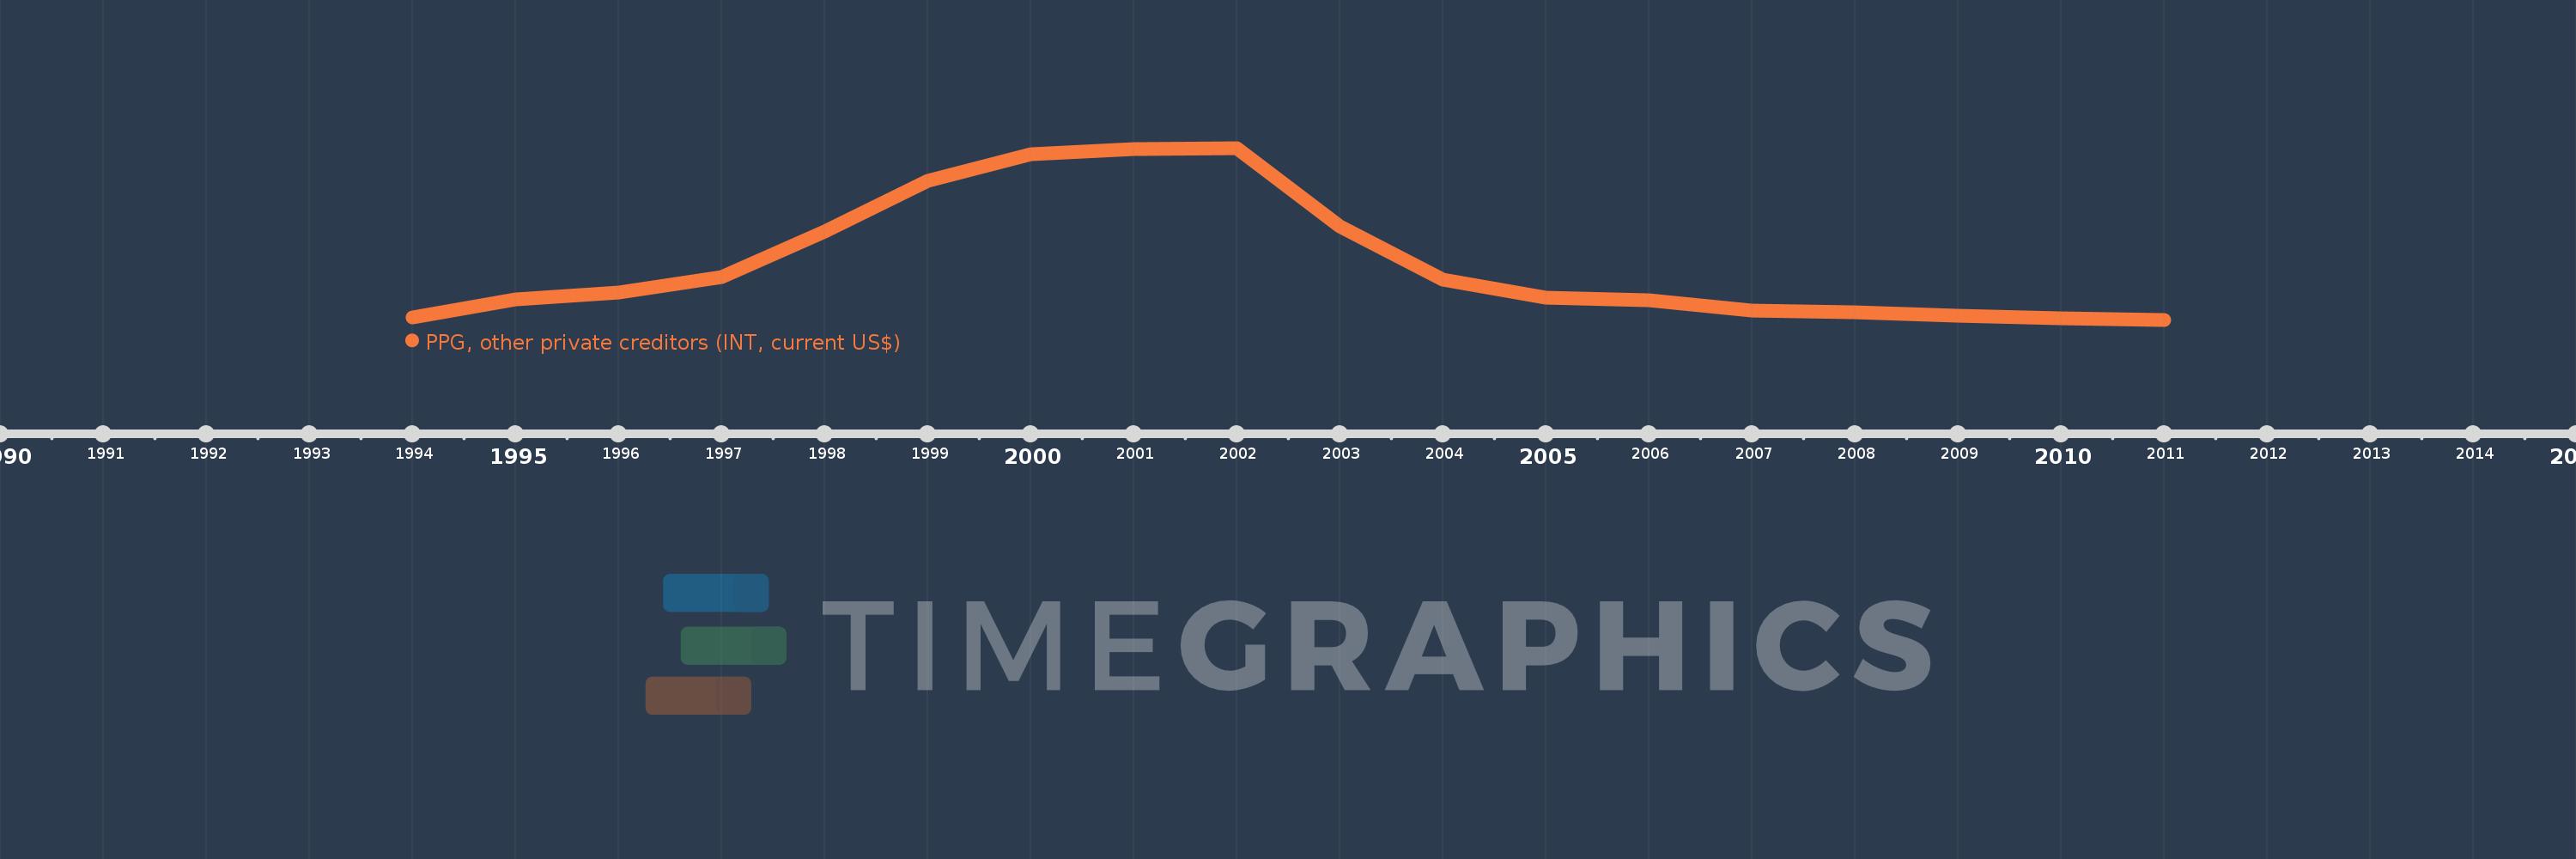
PPG, other private creditors (INT, current US$)
2011,2010,2009,2008,2007,2006,2005,2004,2003,2002,2001,2000,1999,1998,1997,1996,1995,1994
This statistics in other country:
Timeline:
This timeline shows a graph from 1994 to 2011 of Turkmenistan. No data until 1993. Number of actual observations by date: 18.
Source name:
World Development Indicators
Source organization:
World Bank, International Debt Statistics.
Categories, topics:
External Debt
Last updated:
apr 23, 2017
Indicators value changes by year
Maximum:
65.507 mln
jan 1, 2002
At the date of observation
Value
Absolute change
Change from previous value
jan 1, 1994
1.048 mln
+1.048 mln
0.0%
jan 1, 1995
7.848 mln
+6.8 mln
648.85%
jan 1, 1996
10.347 mln
+2.499 mln
31.84%
jan 1, 1997
16.482 mln
+6.135 mln
59.29%
jan 1, 1998
33.608 mln
+17.126 mln
103.91%
jan 1, 1999
53.125 mln
+19.517 mln
58.07%
jan 1, 2000
62.958 mln
+9.833 mln
18.51%
jan 1, 2001
64.979 mln
+2.021 mln
3.21%
jan 1, 2002
65.507 mln
+528.0K
0.81%
jan 1, 2003
35.562 mln
-29.945 mln
-45.71%
jan 1, 2004
15.314 mln
-20.248 mln
-56.94%
jan 1, 2005
8.446 mln
-6.868 mln
-44.85%
jan 1, 2006
7.507 mln
-939.0K
-11.12%
jan 1, 2007
3.52 mln
-3.987 mln
-53.11%
jan 1, 2008
2.847 mln
-673.0K
-19.12%
jan 1, 2009
1.651 mln
-1.196 mln
-42.01%
jan 1, 2010
497.0K
-1.154 mln
-69.9%
jan 1, 2011
67.0K
-430.0K
-86.52%
Ranking of countries by current statistics by years


Comments: