29
/
en
AIzaSyAYiBZKx7MnpbEhh9jyipgxe19OcubqV5w
April 1, 2024
143459
Grenada
GRD
true
2
1
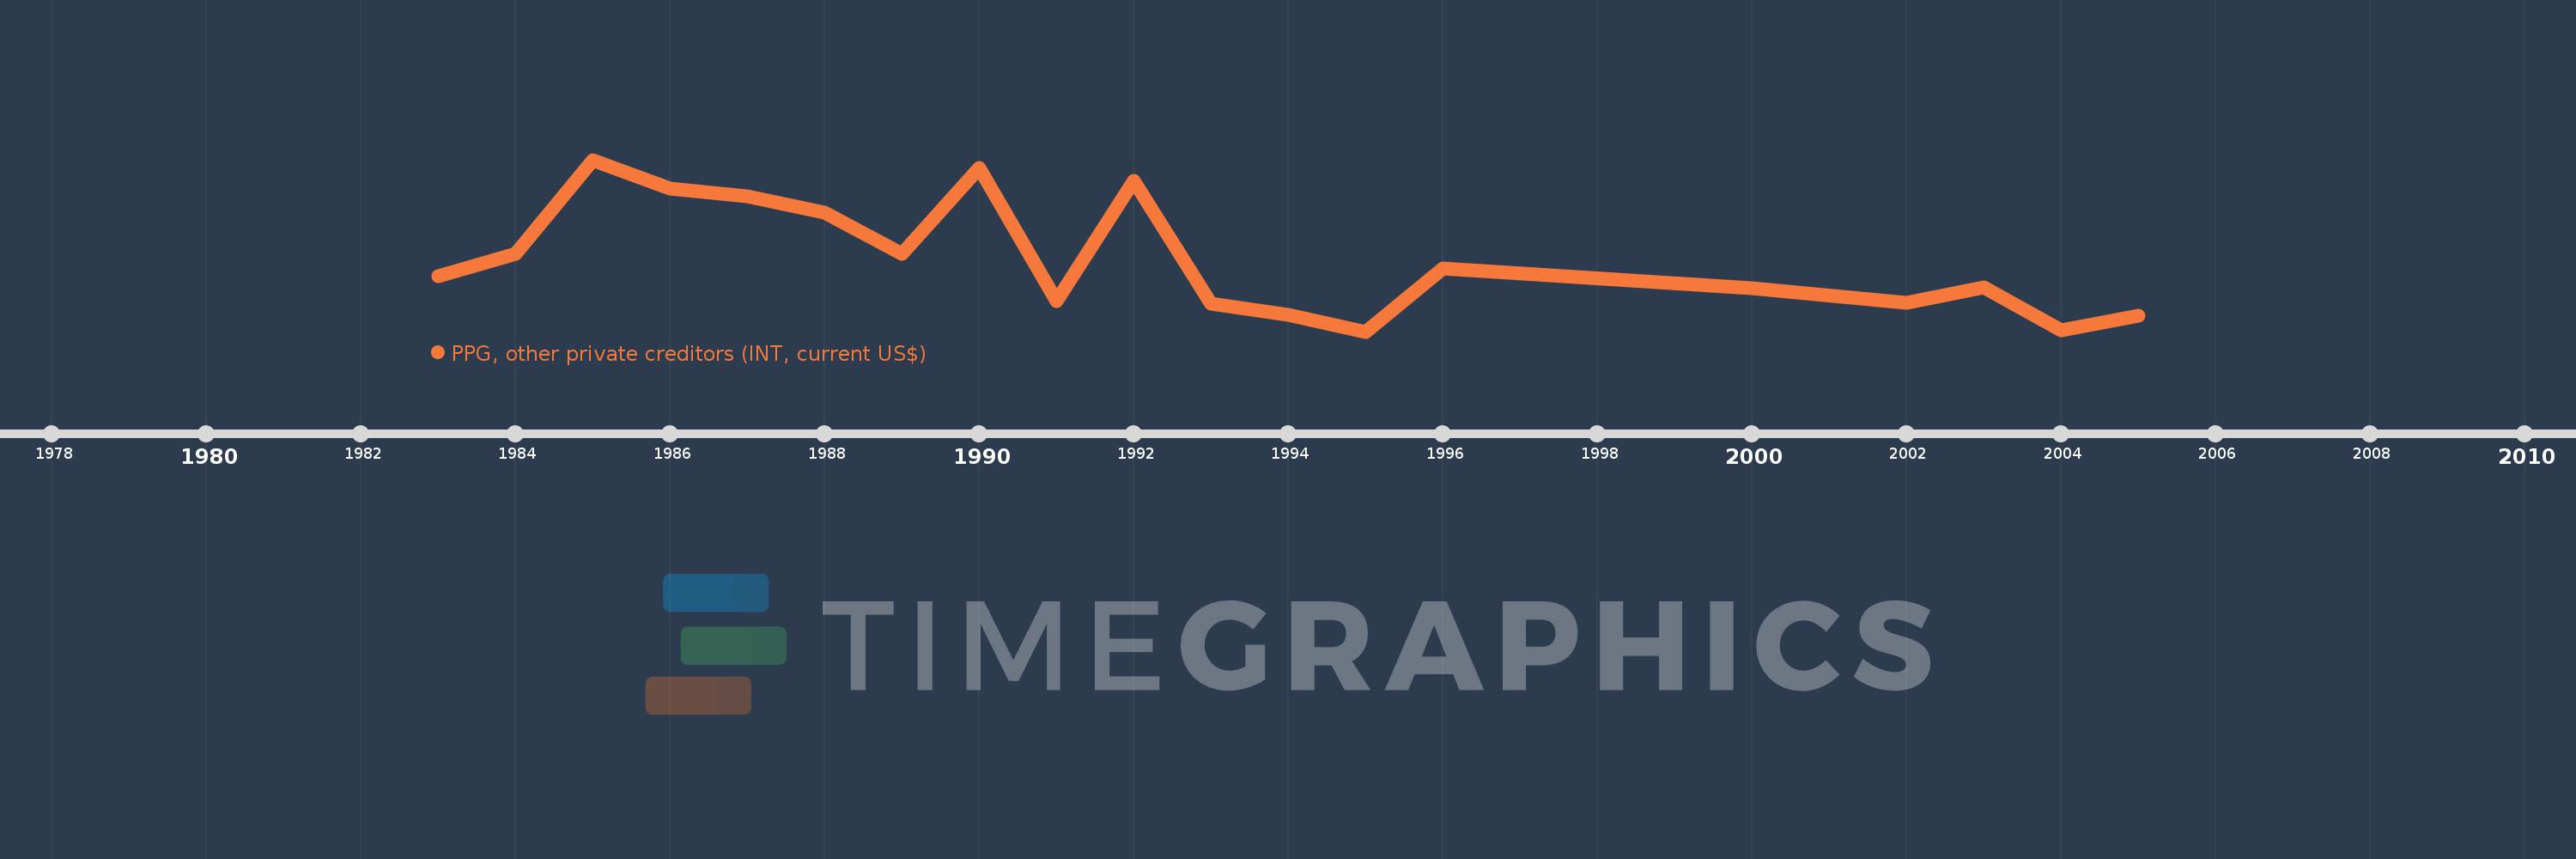
PPG, other private creditors (INT, current US$)
2005,2004,2003,2002,2000,1996,1995,1994,1993,1992,1991,1990,1989,1988,1987,1986,1985,1984,1983
This statistics in other country:
Timeline:
This timeline shows a graph from 1983 to 2005 of Grenada. No data until 1982. Number of actual observations by date: 19.
Source name:
World Development Indicators
Source organization:
World Bank, International Debt Statistics.
Categories, topics:
External Debt
Last updated:
apr 23, 2017
Indicators value changes by year
Maximum:
344.0K
jan 1, 1985
At the date of observation
Value
Absolute change
Change from previous value
jan 1, 1983
120.0K
+120.0K
0.0%
jan 1, 1984
163.0K
+43.0K
35.83%
jan 1, 1985
344.0K
+181.0K
111.04%
jan 1, 1986
289.0K
-55.0K
-15.99%
jan 1, 1987
274.0K
-15.0K
-5.19%
jan 1, 1988
243.0K
-31.0K
-11.31%
jan 1, 1989
163.0K
-80.0K
-32.92%
jan 1, 1990
328.0K
+165.0K
101.23%
jan 1, 1991
72.0K
-256.0K
-78.05%
jan 1, 1992
303.0K
+231.0K
320.83%
jan 1, 1993
66.0K
-237.0K
-78.22%
jan 1, 1994
46.0K
-20.0K
-30.3%
jan 1, 1995
13.0K
-33.0K
-71.74%
jan 1, 1996
135.0K
+122.0K
938.46%
jan 1, 2000
97.0K
-38.0K
-28.15%
jan 1, 2002
69.0K
-28.0K
-28.87%
jan 1, 2003
98.0K
+29.0K
42.03%
jan 1, 2004
16.0K
-82.0K
-83.67%
jan 1, 2005
43.0K
+27.0K
168.75%
Ranking of countries by current statistics by years


Comments: