29
/
en
AIzaSyAYiBZKx7MnpbEhh9jyipgxe19OcubqV5w
April 1, 2024
146206
Guinea
GIN
true
2
1
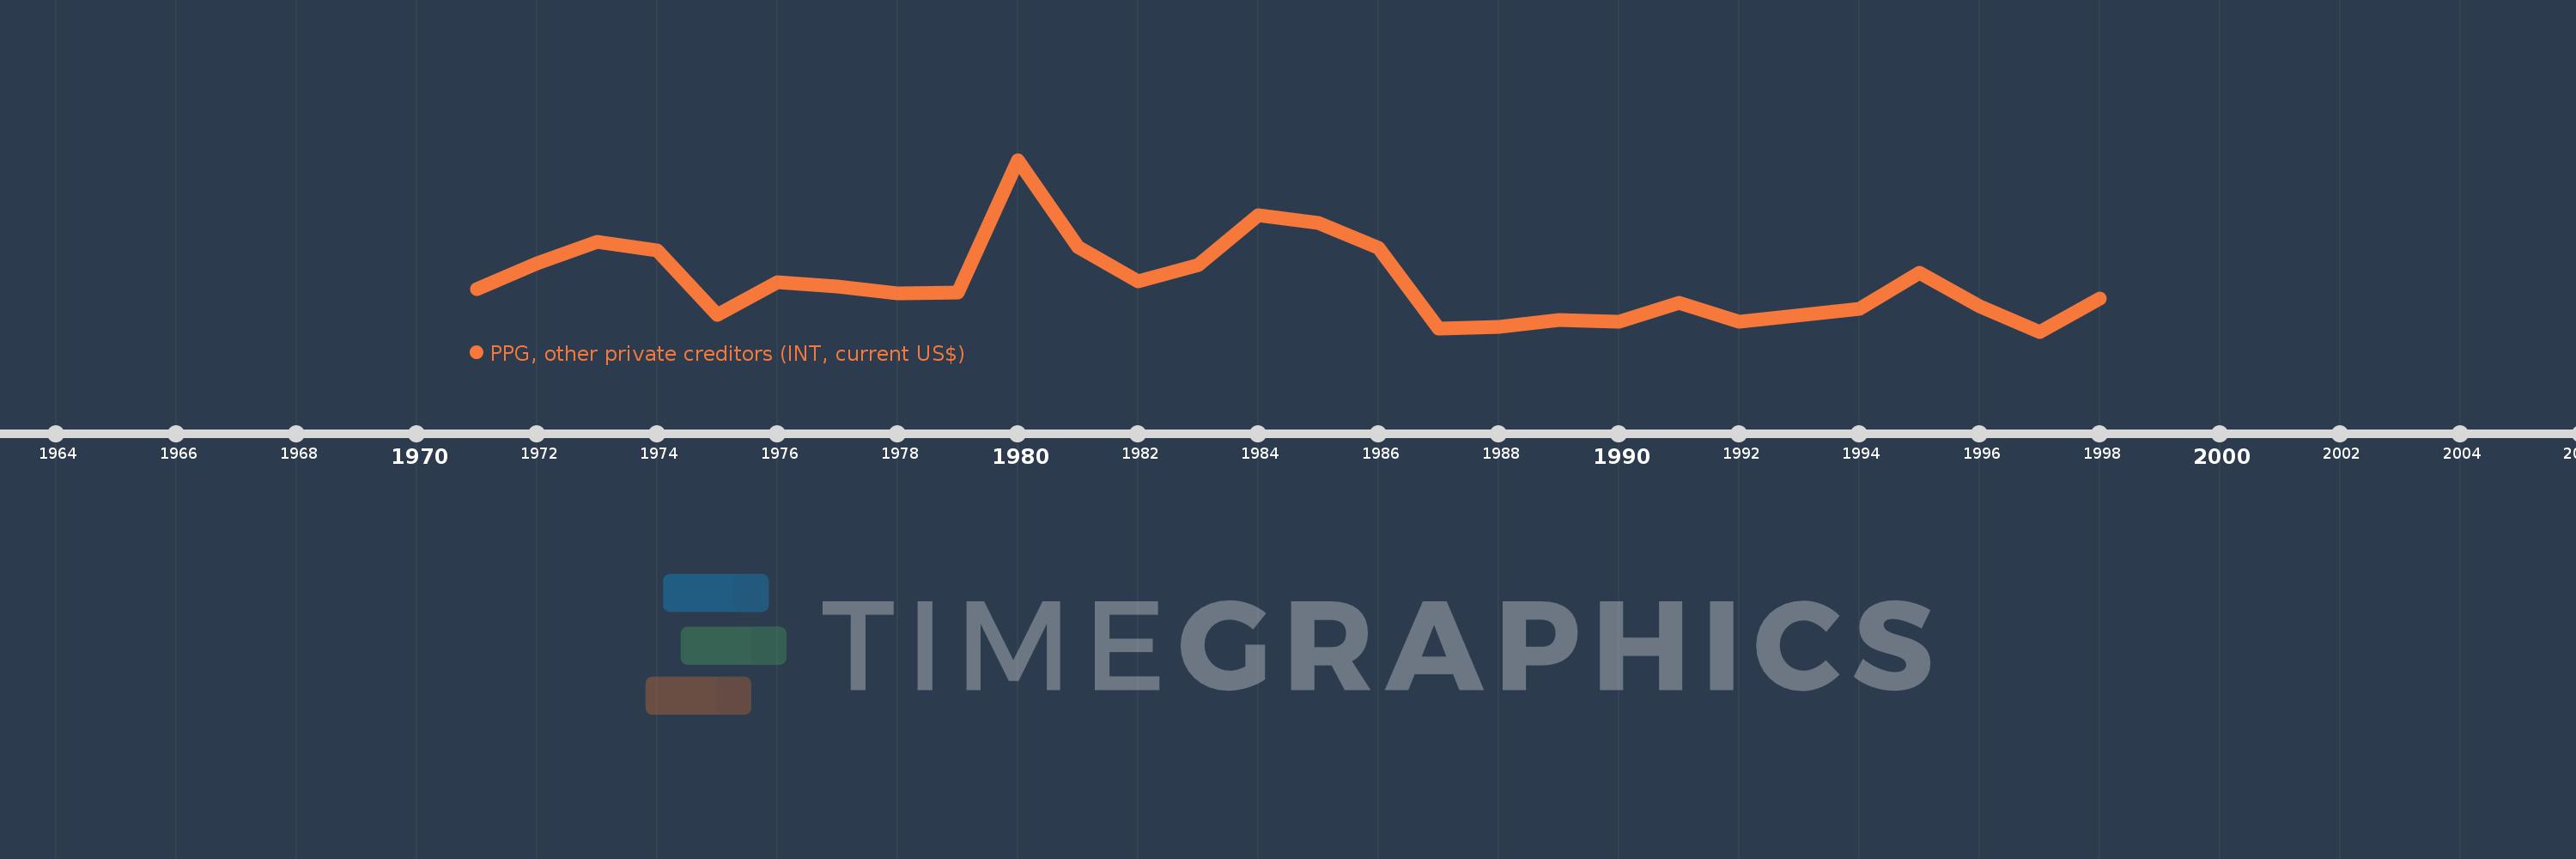
PPG, other private creditors (INT, current US$)
1998,1997,1996,1995,1994,1992,1991,1990,1989,1988,1987,1986,1985,1984,1983,1982,1981,1980,1979,1978,1977,1976,1975,1974,1973,1972,1971
This statistics in other country:
Timeline:
This timeline shows a graph from 1971 to 1998 of Guinea. No data until 1970. Number of actual observations by date: 27.
Source name:
World Development Indicators
Source organization:
World Bank, International Debt Statistics.
Categories, topics:
External Debt
Last updated:
apr 23, 2017
Indicators value changes by year
Minimum:
271.0K
jan 1, 1997
Maximum:
3.902 mln
jan 1, 1980
At the date of observation
Value
Absolute change
Change from previous value
jan 1, 1971
1.172 mln
+1.172 mln
0.0%
jan 1, 1972
1.716 mln
+544.0K
46.42%
jan 1, 1973
2.166 mln
+450.0K
26.22%
jan 1, 1974
1.982 mln
-184.0K
-8.49%
jan 1, 1975
631.0K
-1.351 mln
-68.16%
jan 1, 1976
1.316 mln
+685.0K
108.56%
jan 1, 1977
1.221 mln
-95.0K
-7.22%
jan 1, 1978
1.082 mln
-139.0K
-11.38%
jan 1, 1979
1.096 mln
+14.0K
1.29%
jan 1, 1980
3.902 mln
+2.806 mln
256.02%
jan 1, 1981
2.065 mln
-1.837 mln
-47.08%
jan 1, 1982
1.338 mln
-727.0K
-35.21%
jan 1, 1983
1.676 mln
+338.0K
25.26%
jan 1, 1984
2.736 mln
+1.06 mln
63.25%
jan 1, 1985
2.568 mln
-168.0K
-6.14%
jan 1, 1986
2.048 mln
-520.0K
-20.25%
jan 1, 1987
336.0K
-1.712 mln
-83.59%
jan 1, 1988
365.0K
+29.0K
8.63%
jan 1, 1989
512.0K
+147.0K
40.27%
jan 1, 1990
485.0K
-27.0K
-5.27%
jan 1, 1991
884.0K
+399.0K
82.27%
jan 1, 1992
488.0K
-396.0K
-44.8%
jan 1, 1994
752.0K
+264.0K
54.1%
jan 1, 1995
1.52 mln
+768.0K
102.13%
jan 1, 1996
798.0K
-722.0K
-47.5%
jan 1, 1997
271.0K
-527.0K
-66.04%
jan 1, 1998
977.0K
+706.0K
260.52%
Ranking of countries by current statistics by years


Comments: