29
/
en
AIzaSyAYiBZKx7MnpbEhh9jyipgxe19OcubqV5w
April 1, 2024
246165
South Africa
ZAF
true
2
1
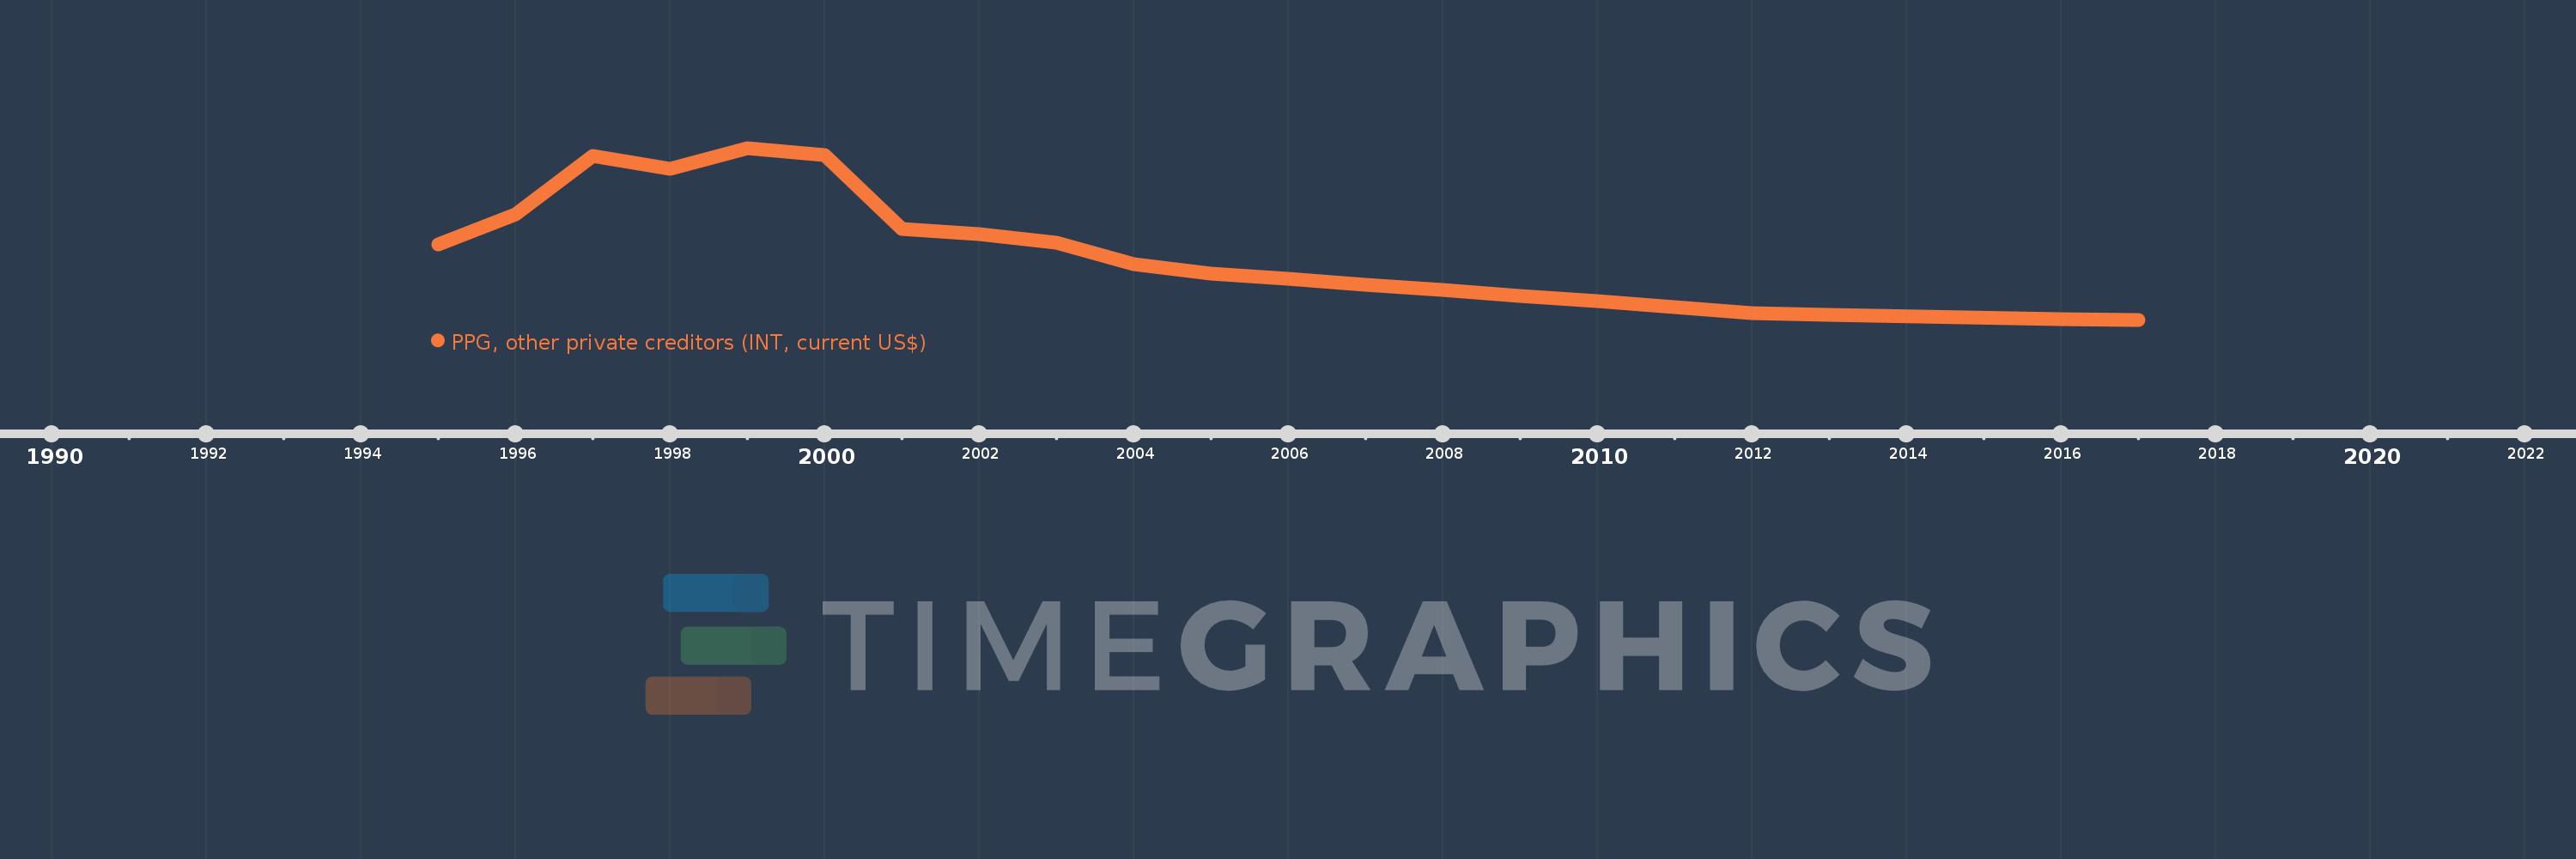
PPG, other private creditors (INT, current US$)
2017,2016,2013,2012,2011,2010,2009,2008,2007,2006,2005,2004,2003,2002,2001,2000,1999,1998,1997,1996,1995
This statistics in other country:
Timeline:
This timeline shows a graph from 1995 to 2017 of South Africa. No data until 1994. Number of actual observations by date: 21.
Source name:
World Development Indicators
Source organization:
World Bank, International Debt Statistics.
Categories, topics:
External Debt
Last updated:
apr 23, 2017
Indicators value changes by year
Maximum:
266.387 mln
jan 1, 1999
At the date of observation
Value
Absolute change
Change from previous value
jan 1, 1995
117.456 mln
+117.456 mln
0.0%
jan 1, 1996
163.519 mln
+46.063 mln
39.22%
jan 1, 1997
253.788 mln
+90.269 mln
55.2%
jan 1, 1998
234.256 mln
-19.532 mln
-7.7%
jan 1, 1999
266.387 mln
+32.131 mln
13.72%
jan 1, 2000
255.24 mln
-11.147 mln
-4.18%
jan 1, 2001
140.241 mln
-114.999 mln
-45.06%
jan 1, 2002
132.672 mln
-7.569 mln
-5.4%
jan 1, 2003
119.708 mln
-12.964 mln
-9.77%
jan 1, 2004
86.676 mln
-33.032 mln
-27.59%
jan 1, 2005
71.882 mln
-14.794 mln
-17.07%
jan 1, 2006
63.17 mln
-8.712 mln
-12.12%
jan 1, 2007
54.456 mln
-8.714 mln
-13.79%
jan 1, 2008
45.744 mln
-8.712 mln
-16.0%
jan 1, 2009
37.03 mln
-8.714 mln
-19.05%
jan 1, 2010
28.318 mln
-8.712 mln
-23.53%
jan 1, 2011
19.604 mln
-8.714 mln
-30.77%
jan 1, 2012
10.891 mln
-8.713 mln
-44.45%
jan 1, 2013
7.47 mln
-3.421 mln
-31.41%
jan 1, 2016
430.0K
-7.04 mln
-94.24%
jan 1, 2017
0.0
-430.0K
-100.0%
Ranking of countries by current statistics by years


Comments: