29
/
en
AIzaSyAYiBZKx7MnpbEhh9jyipgxe19OcubqV5w
April 1, 2024
210955
Nicaragua
NIC
true
2
1
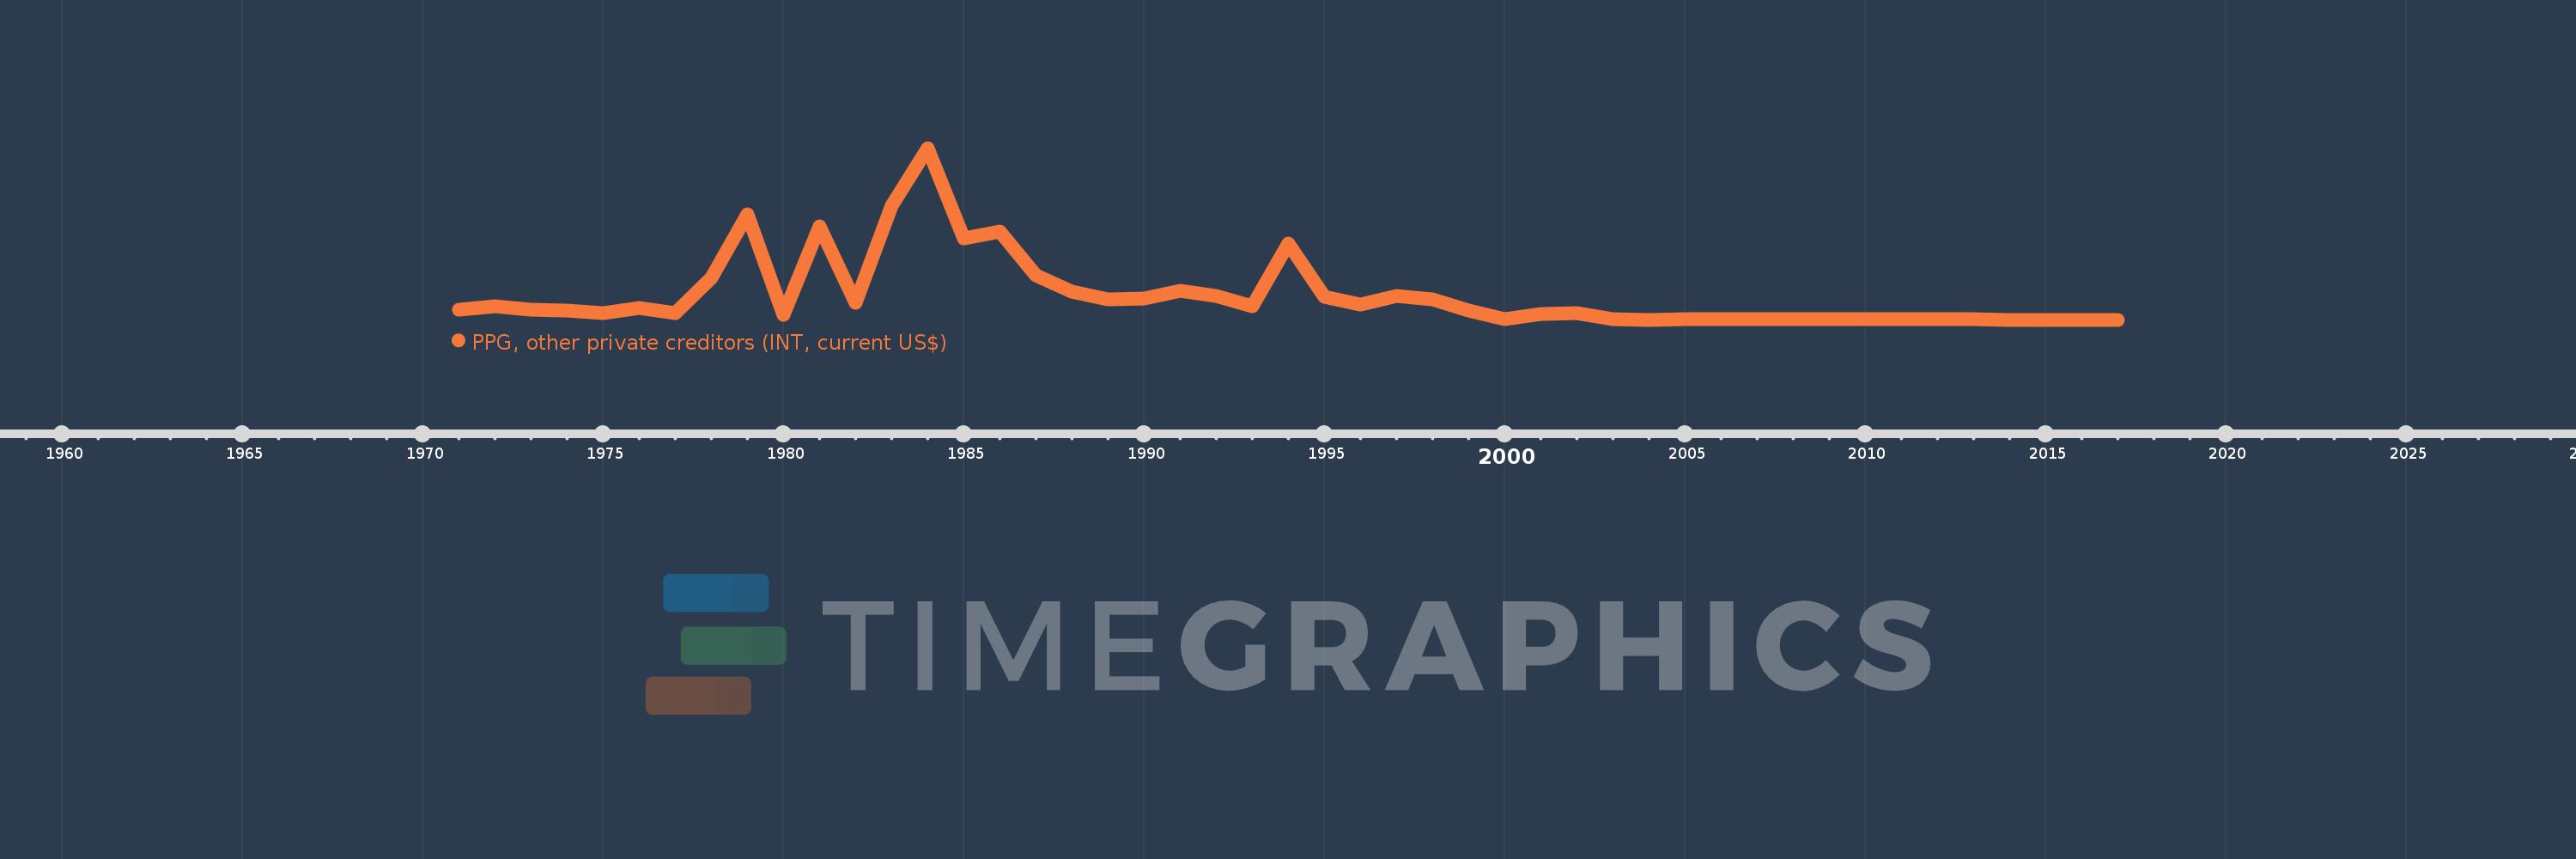
PPG, other private creditors (INT, current US$)
2017,2016,2015,2014,2013,2012,2011,2010,2009,2008,2007,2006,2005,2004,2003,2002,2001,2000,1999,1998,1997,1996,1995,1994,1993,1992,1991,1990,1989,1988,1987,1986,1985,1984,1983,1982,1981,1980,1979,1978,1977,1976,1975,1974,1973,1972,1971
This statistics in other country:
Timeline:
This timeline shows a graph from 1971 to 2017 of Nicaragua. No data until 1970. Number of actual observations by date: 47.
Source name:
World Development Indicators
Source organization:
World Bank, International Debt Statistics.
Categories, topics:
External Debt
Last updated:
apr 23, 2017
Indicators value changes by year
Maximum:
7.0 mln
jan 1, 1984
At the date of observation
Value
Absolute change
Change from previous value
jan 1, 1971
425.0K
+425.0K
0.0%
jan 1, 1972
555.0K
+130.0K
30.59%
jan 1, 1973
410.0K
-145.0K
-26.13%
jan 1, 1974
407.0K
-3.0K
-0.73%
jan 1, 1975
299.0K
-108.0K
-26.54%
jan 1, 1976
491.0K
+192.0K
64.21%
jan 1, 1977
289.0K
-202.0K
-41.14%
jan 1, 1978
1.713 mln
+1.424 mln
492.73%
jan 1, 1979
4.303 mln
+2.59 mln
151.2%
jan 1, 1980
206.0K
-4.097 mln
-95.21%
jan 1, 1981
3.824 mln
+3.618 mln
1.76K%
jan 1, 1982
720.0K
-3.104 mln
-81.17%
jan 1, 1983
4.647 mln
+3.927 mln
545.42%
jan 1, 1984
7.0 mln
+2.353 mln
50.63%
jan 1, 1985
3.336 mln
-3.664 mln
-52.34%
jan 1, 1986
3.594 mln
+258.0K
7.73%
jan 1, 1987
1.839 mln
-1.755 mln
-48.83%
jan 1, 1988
1.176 mln
-663.0K
-36.05%
jan 1, 1989
846.0K
-330.0K
-28.06%
jan 1, 1990
893.0K
+47.0K
5.56%
jan 1, 1991
1.19 mln
+297.0K
33.26%
jan 1, 1992
981.0K
-209.0K
-17.56%
jan 1, 1993
573.0K
-408.0K
-41.59%
jan 1, 1994
3.121 mln
+2.548 mln
444.68%
jan 1, 1995
964.0K
-2.157 mln
-69.11%
jan 1, 1996
622.0K
-342.0K
-35.48%
jan 1, 1997
974.0K
+352.0K
56.59%
jan 1, 1998
834.0K
-140.0K
-14.37%
jan 1, 1999
407.0K
-427.0K
-51.2%
jan 1, 2000
58.0K
-349.0K
-85.75%
jan 1, 2001
267.0K
+209.0K
360.34%
jan 1, 2002
269.0K
+2.0K
0.75%
jan 1, 2003
35.0K
-234.0K
-86.99%
jan 1, 2004
21.0K
-14.0K
-40.0%
jan 1, 2005
25.0K
+4.0K
19.05%
jan 1, 2006
27.0K
+2.0K
8.0%
jan 1, 2007
25.0K
-2.0K
-7.41%
jan 1, 2008
26.0K
+1000.0
4.0%
jan 1, 2009
27.0K
+1000.0
3.85%
jan 1, 2010
26.0K
-1000.0
-3.7%
jan 1, 2011
24.0K
-2.0K
-7.69%
jan 1, 2012
25.0K
+1000.0
4.17%
jan 1, 2013
24.0K
-1000.0
-4.0%
jan 1, 2014
23.0K
-1000.0
-4.17%
jan 1, 2015
23.0K
0.0
0.0%
jan 1, 2016
21.0K
-2.0K
-8.7%
jan 1, 2017
17.0K
-4.0K
-19.05%
Ranking of countries by current statistics by years


Comments: