29
/
en
AIzaSyAYiBZKx7MnpbEhh9jyipgxe19OcubqV5w
April 1, 2024
267497
Trinidad and Tobago
TTO
true
2
1
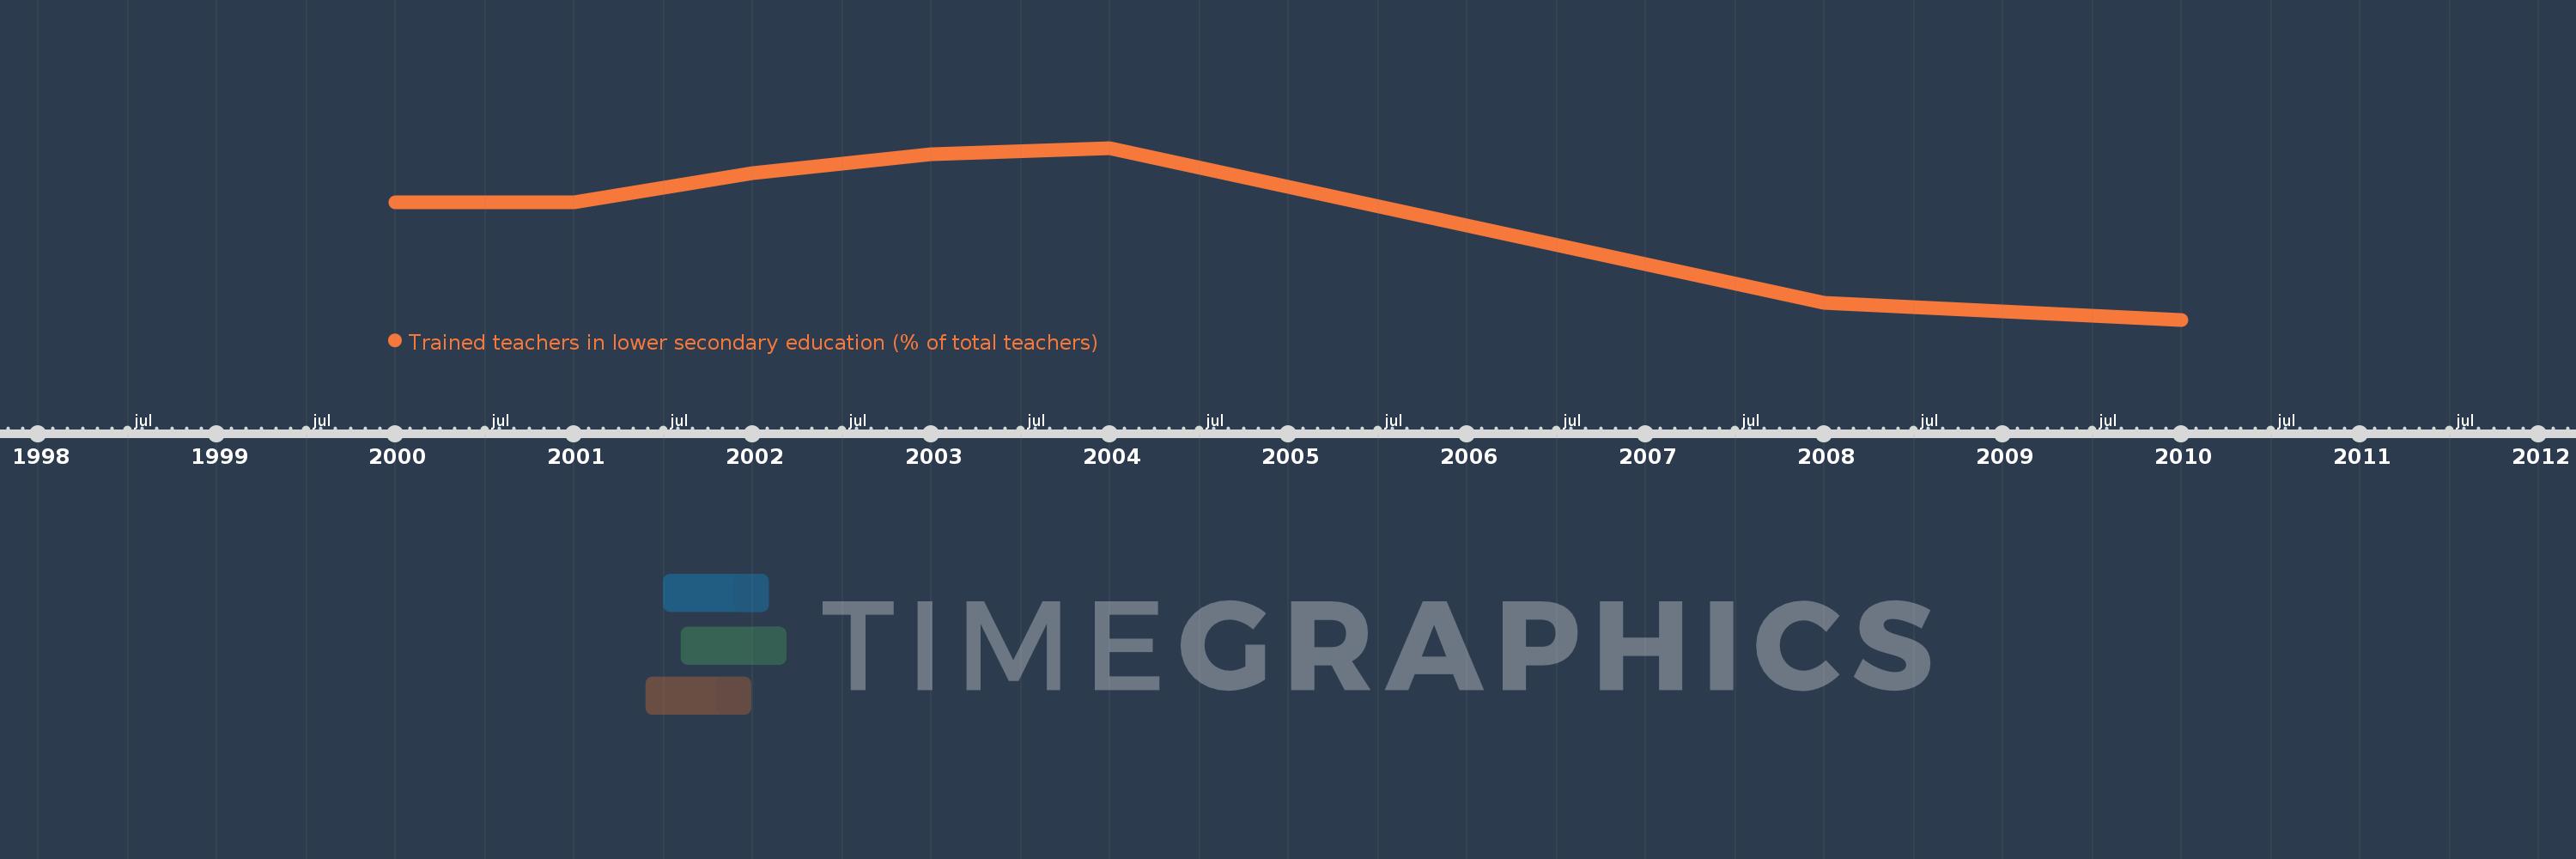
Trained teachers in lower secondary education (% of total teachers)
2010,2008,2004,2003,2002,2001,2000
This statistics in other country:
Timeline:
This timeline shows a graph from 2000 to 2010 of Trinidad and Tobago. No data until 1999. Number of actual observations by date: 7.
Source name:
World Development Indicators
Source organization:
United Nations Educational, Scientific, and Cultural Organization (UNESCO) Institute for Statistics.
Categories, topics:
Education
Last updated:
apr 23, 2017
Indicators value changes by year
Minimum:
40.378
jan 1, 2010
Maximum:
58.003
jan 1, 2004
At the date of observation
Value
Absolute change
Change from previous value
jan 1, 2000
52.412
+52.412
0.0%
jan 1, 2001
52.399
-0.013
-0.02%
jan 1, 2002
55.398
+3.0
5.72%
jan 1, 2003
57.396
+1.998
3.61%
jan 1, 2004
58.003
+0.607
1.06%
jan 1, 2008
42.103
-15.9
-27.41%
jan 1, 2010
40.378
-1.725
-4.1%
Ranking of countries by current statistics by years


Comments: