29
/
en
AIzaSyAYiBZKx7MnpbEhh9jyipgxe19OcubqV5w
April 1, 2024
116298
Cuba
CUB
true
2
1
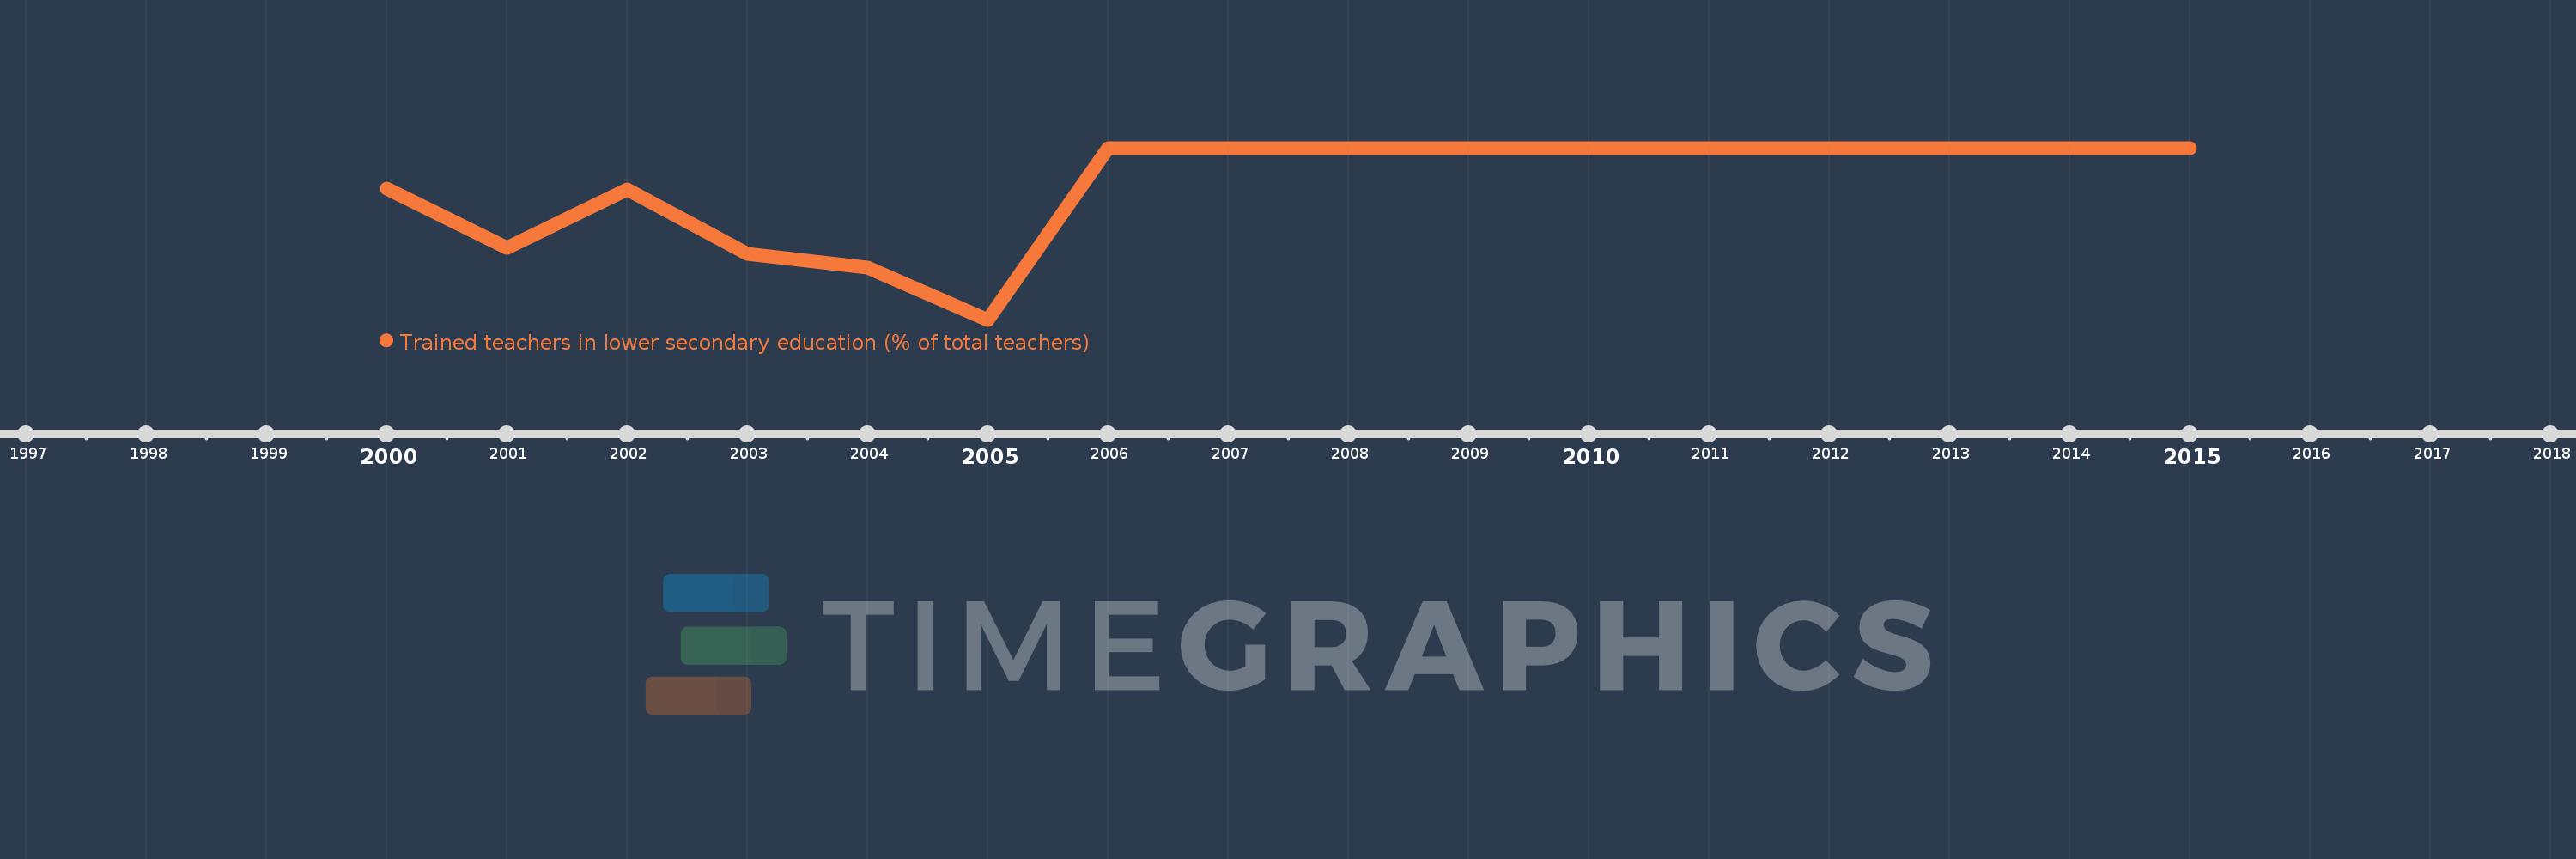
Trained teachers in lower secondary education (% of total teachers)
2015,2014,2013,2012,2011,2010,2009,2008,2007,2006,2005,2004,2003,2002,2001,2000
This statistics in other country:
Timeline:
This timeline shows a graph from 2000 to 2015 of Cuba. No data until 1999. Number of actual observations by date: 16.
Source name:
World Development Indicators
Source organization:
United Nations Educational, Scientific, and Cultural Organization (UNESCO) Institute for Statistics.
Categories, topics:
Education
Last updated:
apr 23, 2017
Indicators value changes by year
Minimum:
76.964
jan 1, 2005
At the date of observation
Value
Absolute change
Change from previous value
jan 1, 2000
94.56
+94.56
0.0%
jan 1, 2001
86.641
-7.919
-8.37%
jan 1, 2002
94.472
+7.831
9.04%
jan 1, 2003
85.779
-8.693
-9.2%
jan 1, 2004
83.955
-1.824
-2.13%
jan 1, 2005
76.964
-6.99
-8.33%
jan 1, 2006
100.0
+23.036
29.93%
jan 1, 2007
100.0
0.0
0.0%
jan 1, 2008
100.0
0.0
0.0%
jan 1, 2009
100.0
0.0
0.0%
jan 1, 2010
100.0
0.0
0.0%
jan 1, 2011
100.0
0.0
0.0%
jan 1, 2012
100.0
0.0
0.0%
jan 1, 2013
100.0
0.0
0.0%
jan 1, 2014
100.0
0.0
0.0%
jan 1, 2015
100.0
0.0
0.0%
Ranking of countries by current statistics by years


Comments: