29
/
en
AIzaSyAYiBZKx7MnpbEhh9jyipgxe19OcubqV5w
April 1, 2024
121618
Dominica
DMA
true
2
1
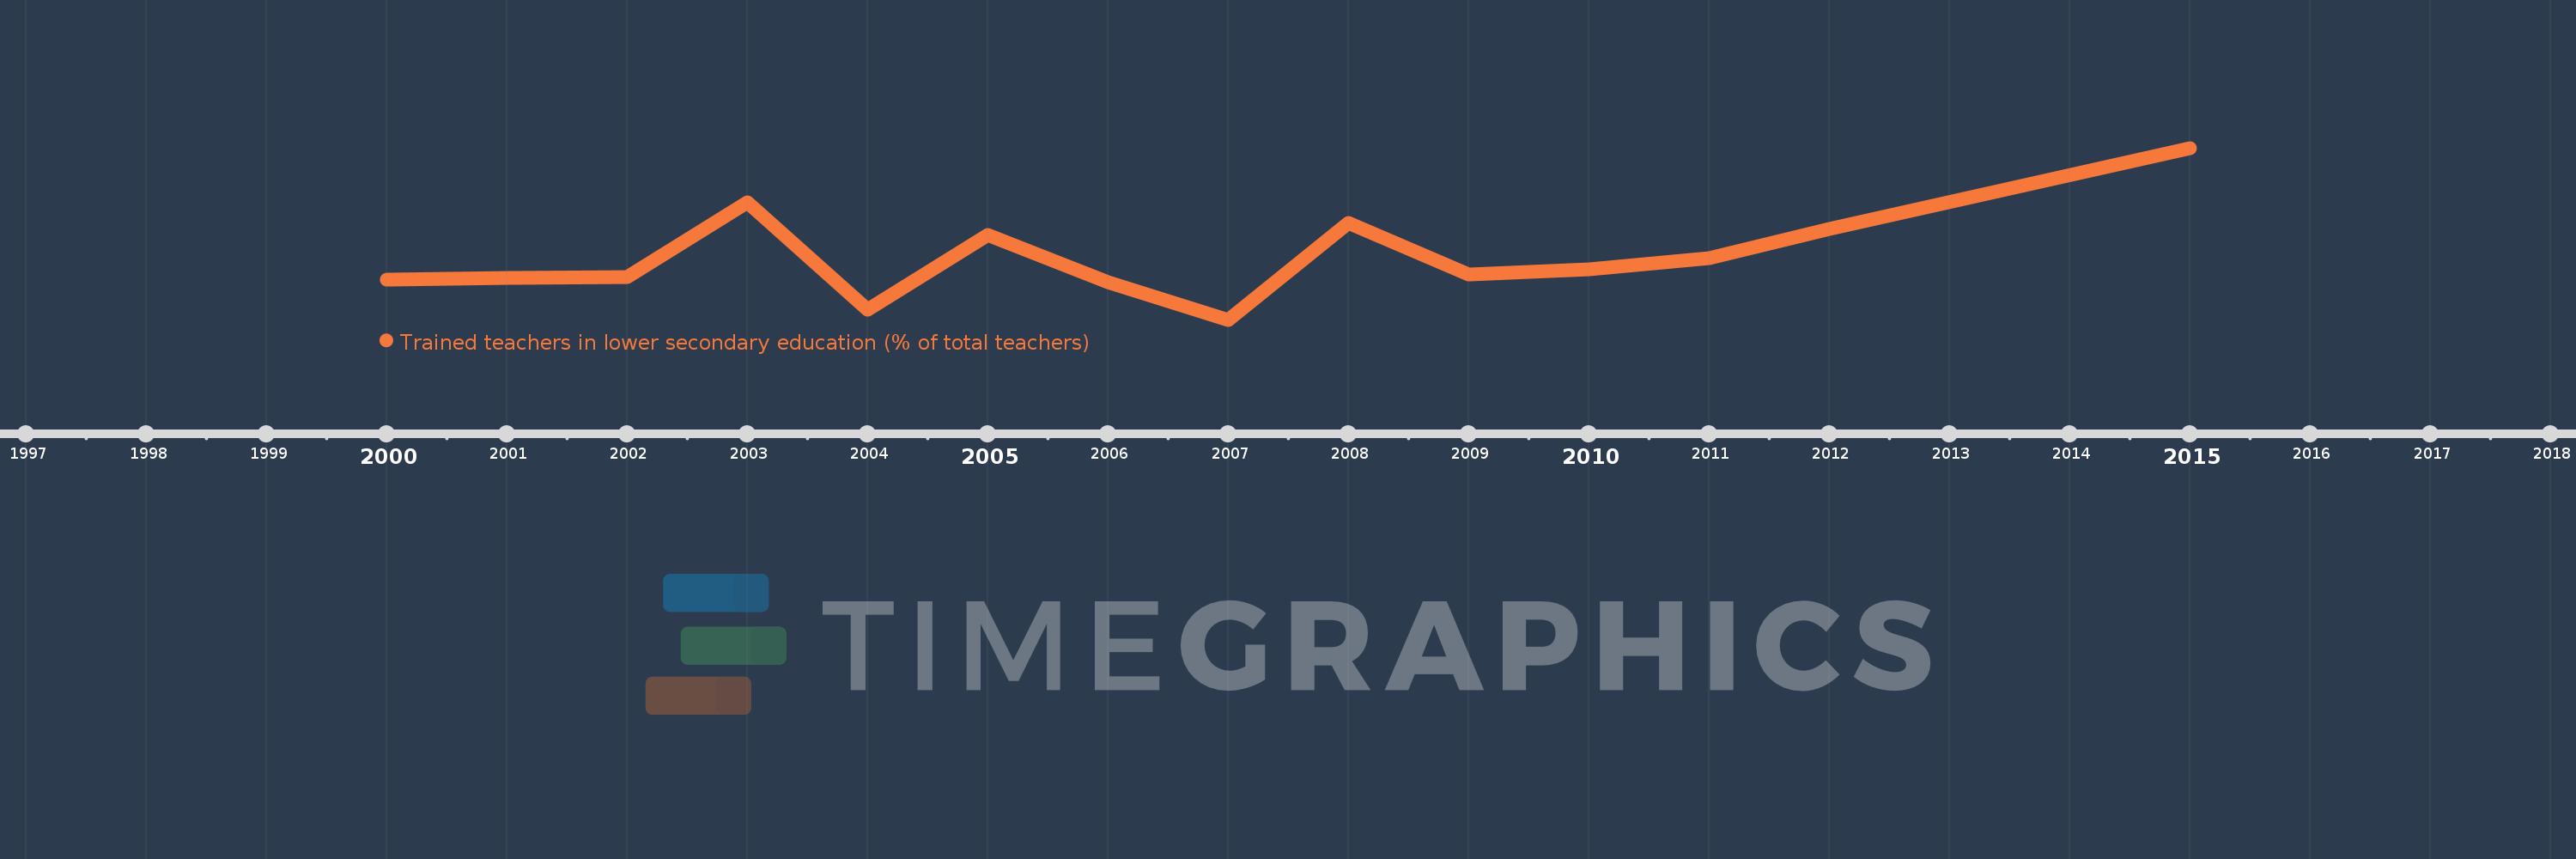
Trained teachers in lower secondary education (% of total teachers)
2015,2012,2011,2010,2009,2008,2007,2006,2005,2004,2003,2002,2001,2000
This statistics in other country:
Timeline:
This timeline shows a graph from 2000 to 2015 of Dominica. No data until 1999. Number of actual observations by date: 14.
Source name:
World Development Indicators
Source organization:
United Nations Educational, Scientific, and Cultural Organization (UNESCO) Institute for Statistics.
Categories, topics:
Education
Last updated:
apr 23, 2017
Indicators value changes by year
Minimum:
26.721
jan 1, 2007
Maximum:
46.154
jan 1, 2015
At the date of observation
Value
Absolute change
Change from previous value
jan 1, 2000
31.25
+31.25
0.0%
jan 1, 2001
31.496
+0.246
0.79%
jan 1, 2002
31.579
+0.083
0.26%
jan 1, 2003
40.0
+8.421
26.67%
jan 1, 2004
27.864
-12.136
-30.34%
jan 1, 2005
36.306
+8.442
30.3%
jan 1, 2006
30.986
-5.32
-14.65%
jan 1, 2007
26.721
-4.265
-13.77%
jan 1, 2008
37.647
+10.926
40.89%
jan 1, 2009
31.818
-5.829
-15.48%
jan 1, 2010
32.394
+0.576
1.81%
jan 1, 2011
33.677
+1.283
3.96%
jan 1, 2012
37.011
+3.334
9.9%
jan 1, 2015
46.154
+9.143
24.7%
Ranking of countries by current statistics by years


Comments: