29
/
en
AIzaSyAYiBZKx7MnpbEhh9jyipgxe19OcubqV5w
April 1, 2024
250390
St. Kitts and Nevis
KNA
true
2
1
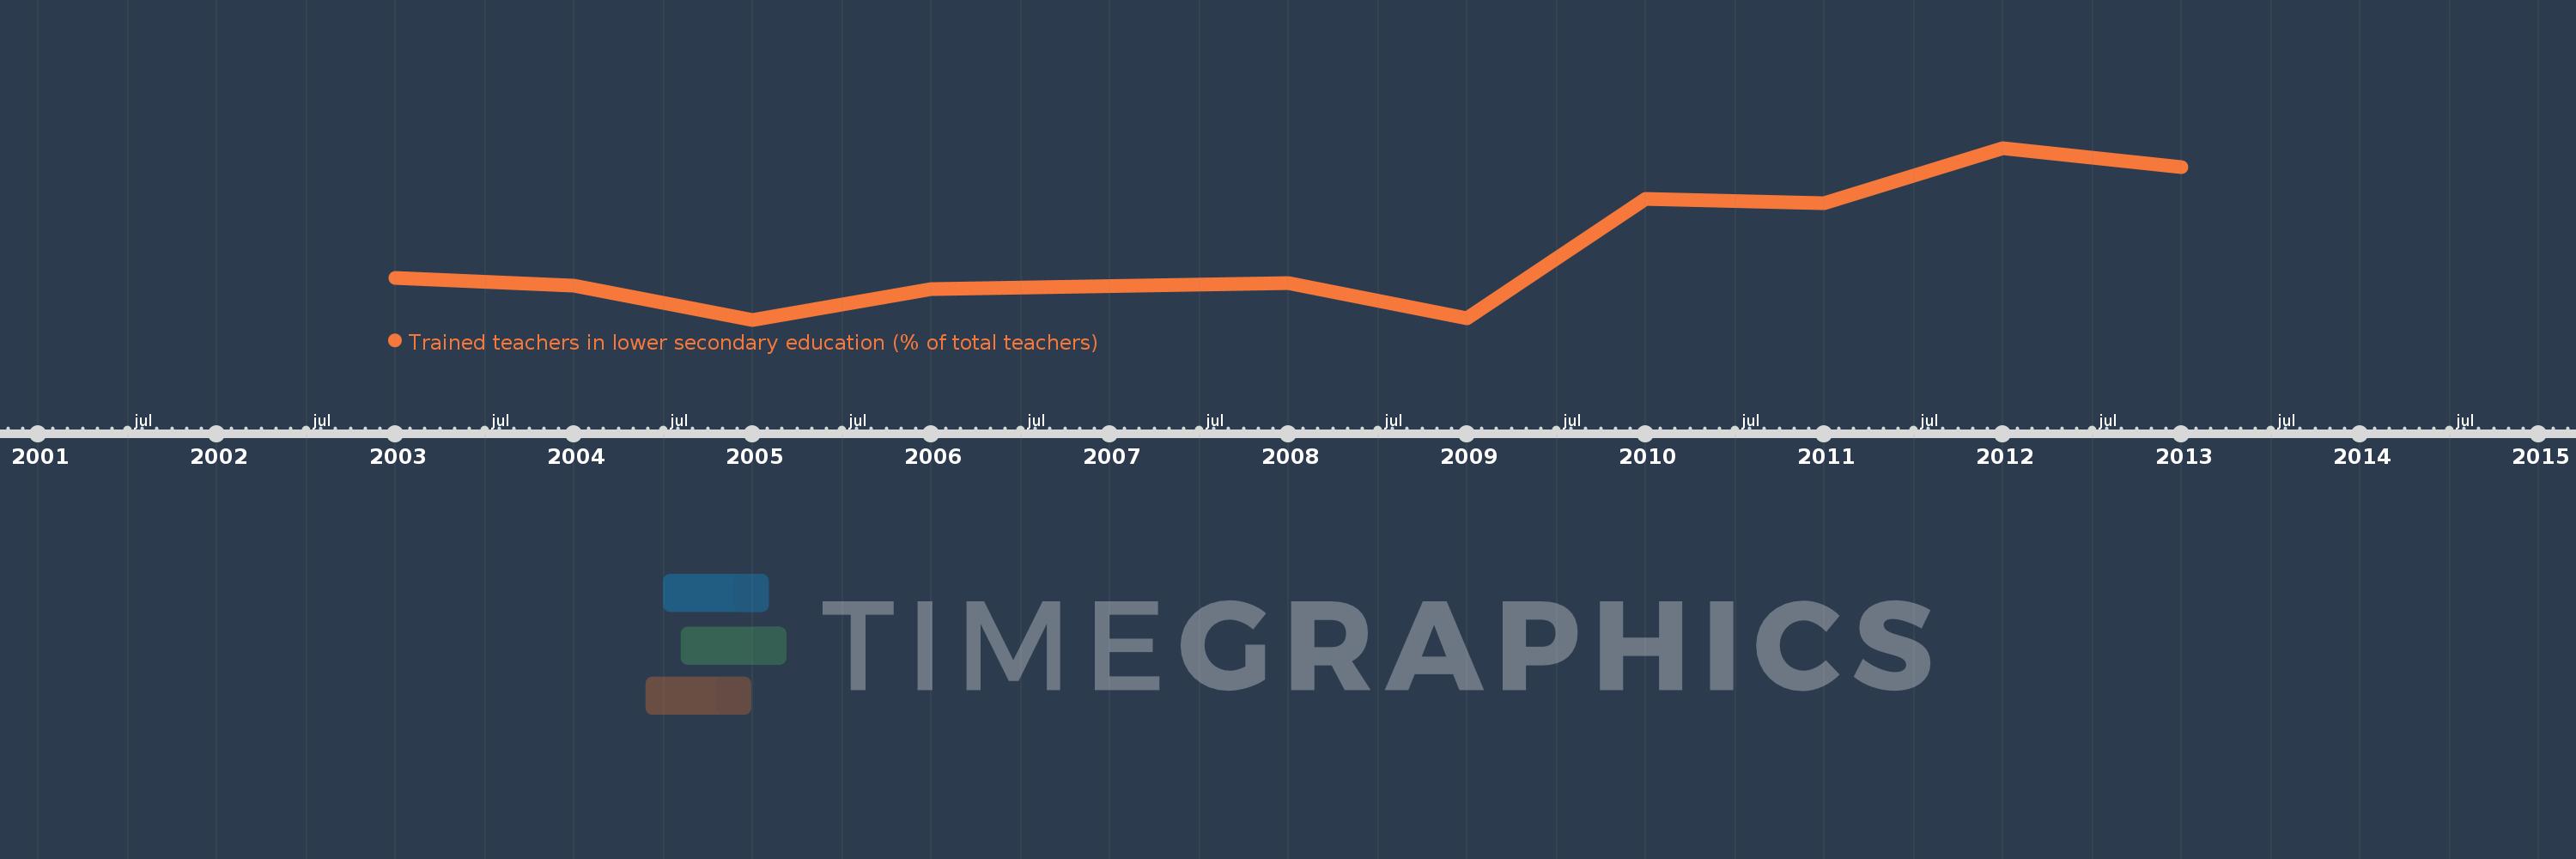
Trained teachers in lower secondary education (% of total teachers)
2013,2012,2011,2010,2009,2008,2006,2005,2004,2003
This statistics in other country:
Timeline:
This timeline shows a graph from 2003 to 2013 of St. Kitts and Nevis. No data until 2002. Number of actual observations by date: 10.
Source name:
World Development Indicators
Source organization:
United Nations Educational, Scientific, and Cultural Organization (UNESCO) Institute for Statistics.
Categories, topics:
Education
Last updated:
apr 23, 2017
Indicators value changes by year
Minimum:
35.424
jan 1, 2005
At the date of observation
Value
Absolute change
Change from previous value
jan 1, 2003
40.37
+40.37
0.0%
jan 1, 2004
39.474
-0.897
-2.22%
jan 1, 2005
35.424
-4.049
-10.26%
jan 1, 2006
39.024
+3.6
10.16%
jan 1, 2008
39.731
+0.706
1.81%
jan 1, 2009
35.606
-4.125
-10.38%
jan 1, 2010
49.66
+14.054
39.47%
jan 1, 2011
49.153
-0.507
-1.02%
jan 1, 2012
55.6
+6.447
13.12%
jan 1, 2013
53.333
-2.267
-4.08%
Ranking of countries by current statistics by years


Comments: