29
/
en
AIzaSyAYiBZKx7MnpbEhh9jyipgxe19OcubqV5w
April 1, 2024
44726
Least developed countries: UN classification
LDC
false
2
1
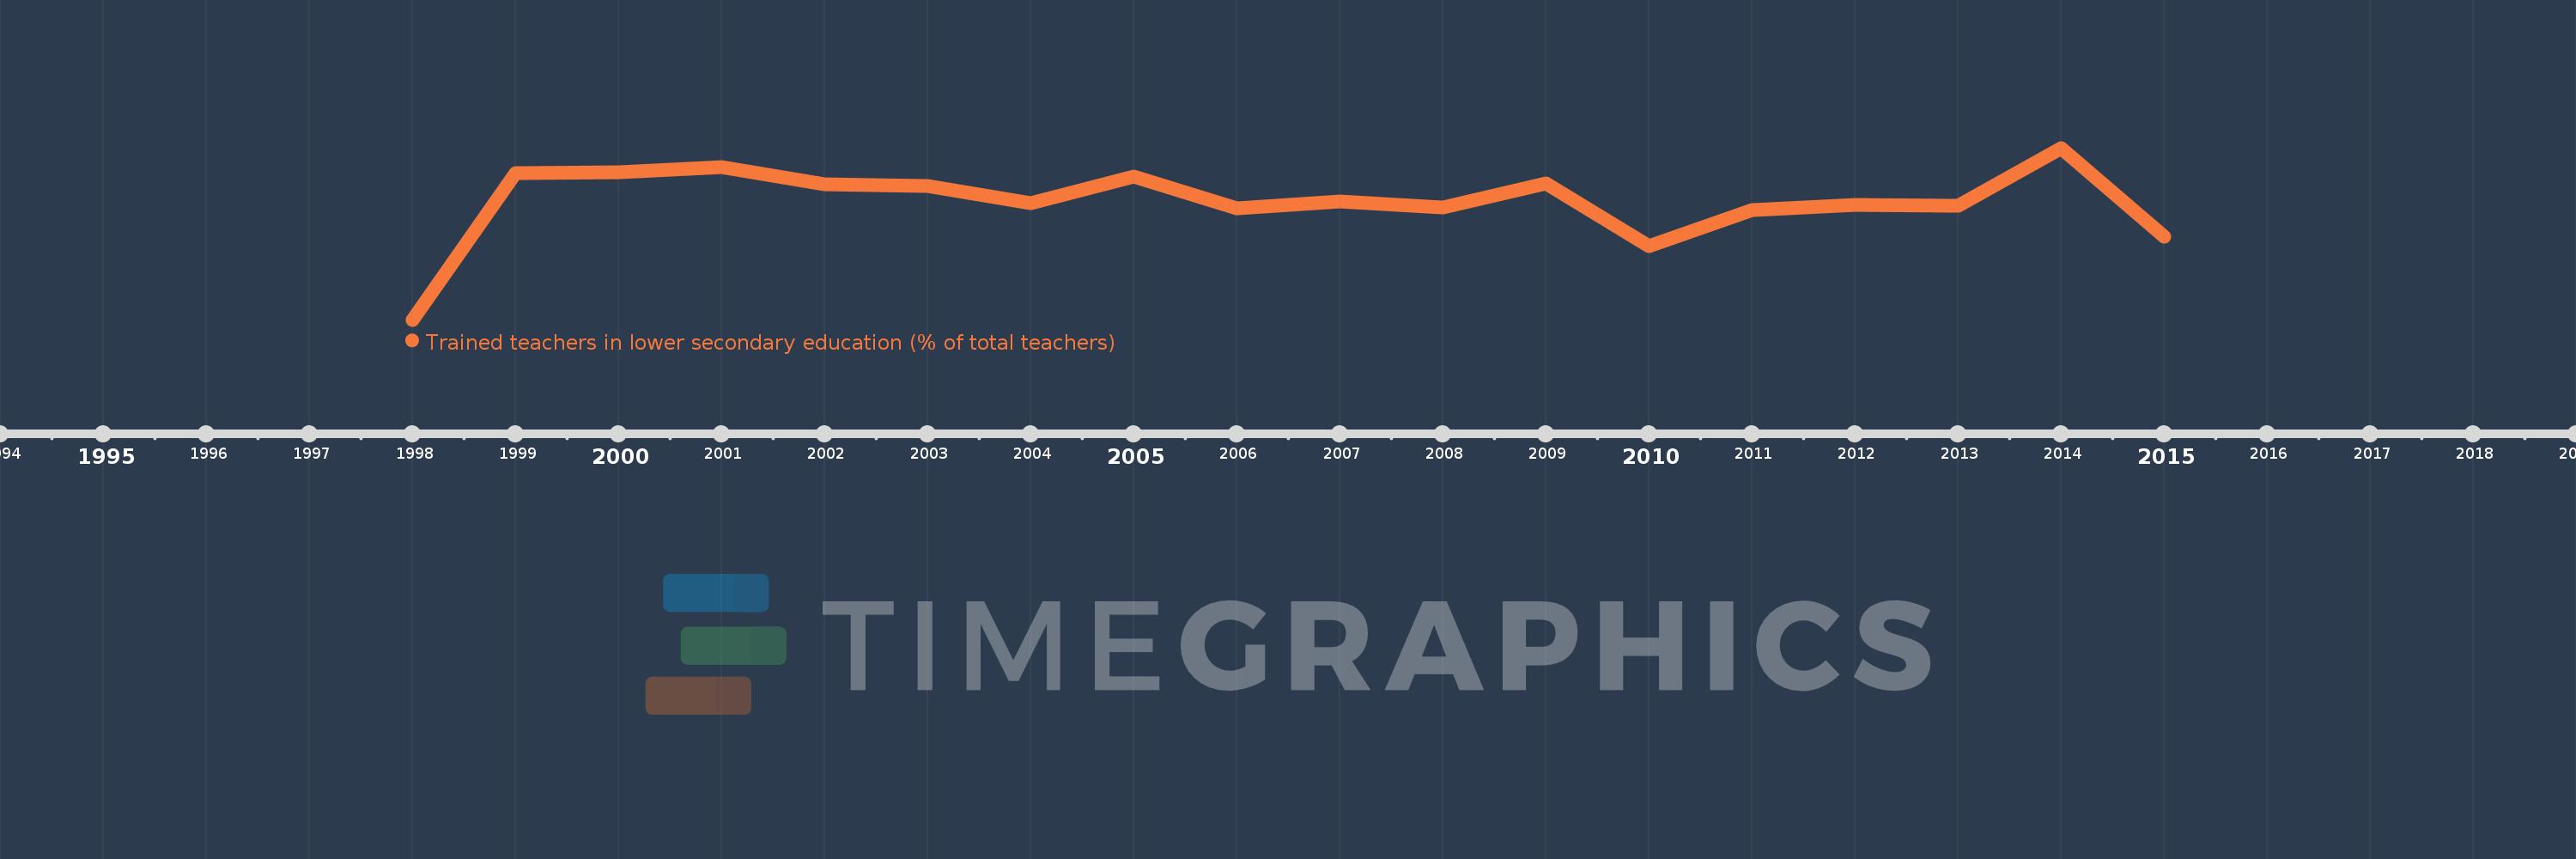
Trained teachers in lower secondary education (% of total teachers)
2015,2014,2013,2012,2011,2010,2009,2008,2007,2006,2005,2004,2003,2002,2001,2000,1999,1998
This statistics in other country:
Timeline:
This timeline shows a graph from 1998 to 2015 of Least developed countries: UN classification. No data until 1997. Number of actual observations by date: 18.
Source name:
World Development Indicators
Source organization:
United Nations Educational, Scientific, and Cultural Organization (UNESCO) Institute for Statistics.
Categories, topics:
Education
Last updated:
apr 23, 2017
Indicators value changes by year
Minimum:
51.567
jan 1, 1998
Maximum:
71.085
jan 1, 2014
At the date of observation
Value
Absolute change
Change from previous value
jan 1, 1998
51.567
+51.567
0.0%
jan 1, 1999
68.19
+16.623
32.24%
jan 1, 2000
68.352
+0.162
0.24%
jan 1, 2001
68.892
+0.54
0.79%
jan 1, 2002
66.946
-1.946
-2.83%
jan 1, 2003
66.753
-0.193
-0.29%
jan 1, 2004
64.851
-1.902
-2.85%
jan 1, 2005
67.858
+3.007
4.64%
jan 1, 2006
64.236
-3.622
-5.34%
jan 1, 2007
64.973
+0.737
1.15%
jan 1, 2008
64.338
-0.635
-0.98%
jan 1, 2009
67.055
+2.717
4.22%
jan 1, 2010
59.972
-7.083
-10.56%
jan 1, 2011
64.023
+4.052
6.76%
jan 1, 2012
64.614
+0.591
0.92%
jan 1, 2013
64.498
-0.116
-0.18%
jan 1, 2014
71.085
+6.587
10.21%
jan 1, 2015
61.02
-10.065
-14.16%
Ranking of countries by current statistics by years


Comments: