29
/
en
AIzaSyAYiBZKx7MnpbEhh9jyipgxe19OcubqV5w
April 1, 2024
264449
Togo
TGO
true
2
1
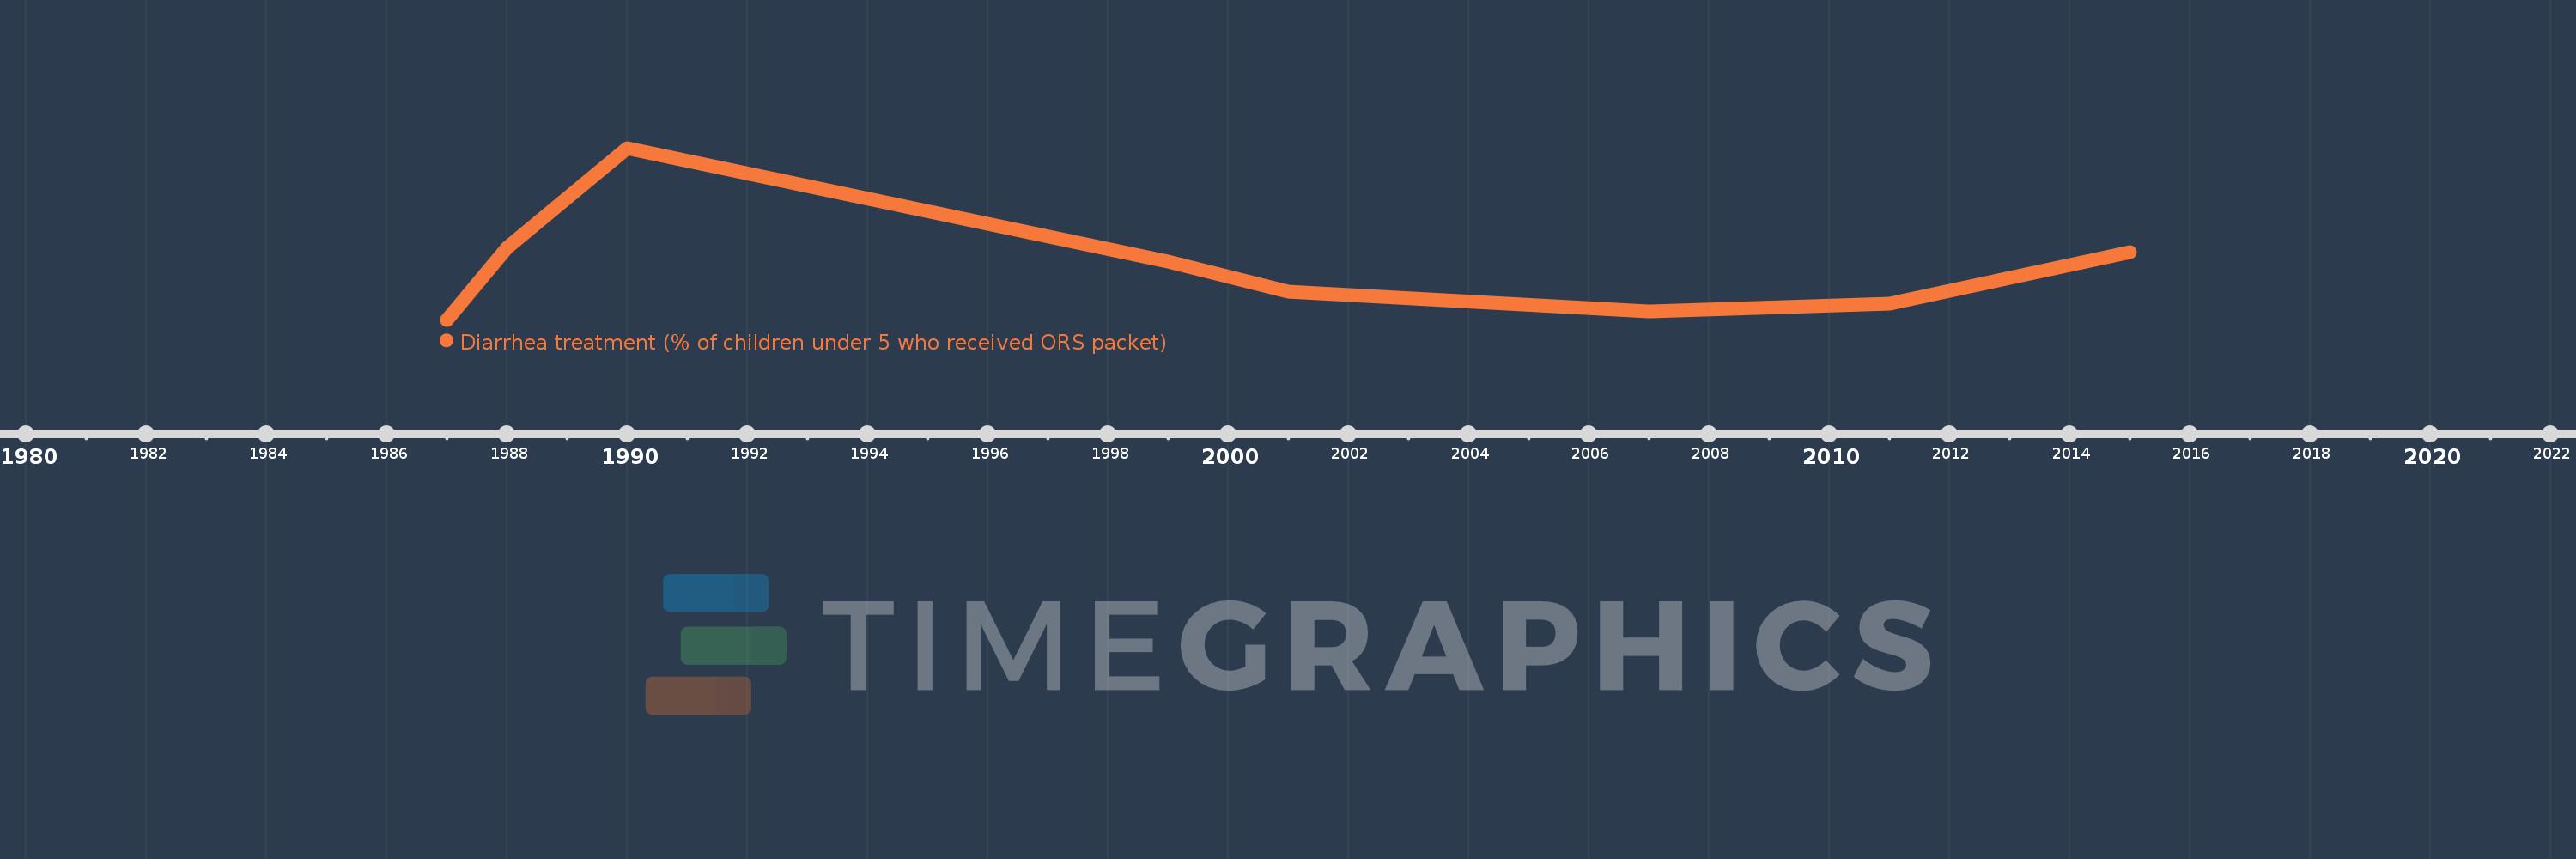
Diarrhea treatment (% of children under 5 who received ORS packet)
2015,2011,2007,2001,1999,1990,1988,1987
This statistics in other country:
Timeline:
This timeline shows a graph from 1987 to 2015 of Togo. No data until 1986. Number of actual observations by date: 8.
Source name:
World Development Indicators
Source organization:
UNICEF, State of the World's Children, Childinfo, and Demographic and Health Surveys.
Categories, topics:
Health
Last updated:
apr 23, 2017
Indicators value changes by year
At the date of observation
Value
Absolute change
Change from previous value
jan 1, 1988
19.0
+10.0
111.11%
jan 1, 1990
33.0
+14.0
73.68%
jan 1, 1999
17.1
-15.9
-48.18%
jan 1, 2001
12.9
-4.2
-24.56%
jan 1, 2007
10.171
-2.729
-21.15%
jan 1, 2011
11.3
+1.129
11.1%
jan 1, 2015
18.5
+7.2
63.72%
Ranking of countries by current statistics by years


Comments: