29
/
en
AIzaSyAYiBZKx7MnpbEhh9jyipgxe19OcubqV5w
April 1, 2024
113454
Cote d'Ivoire
CIV
true
2
1
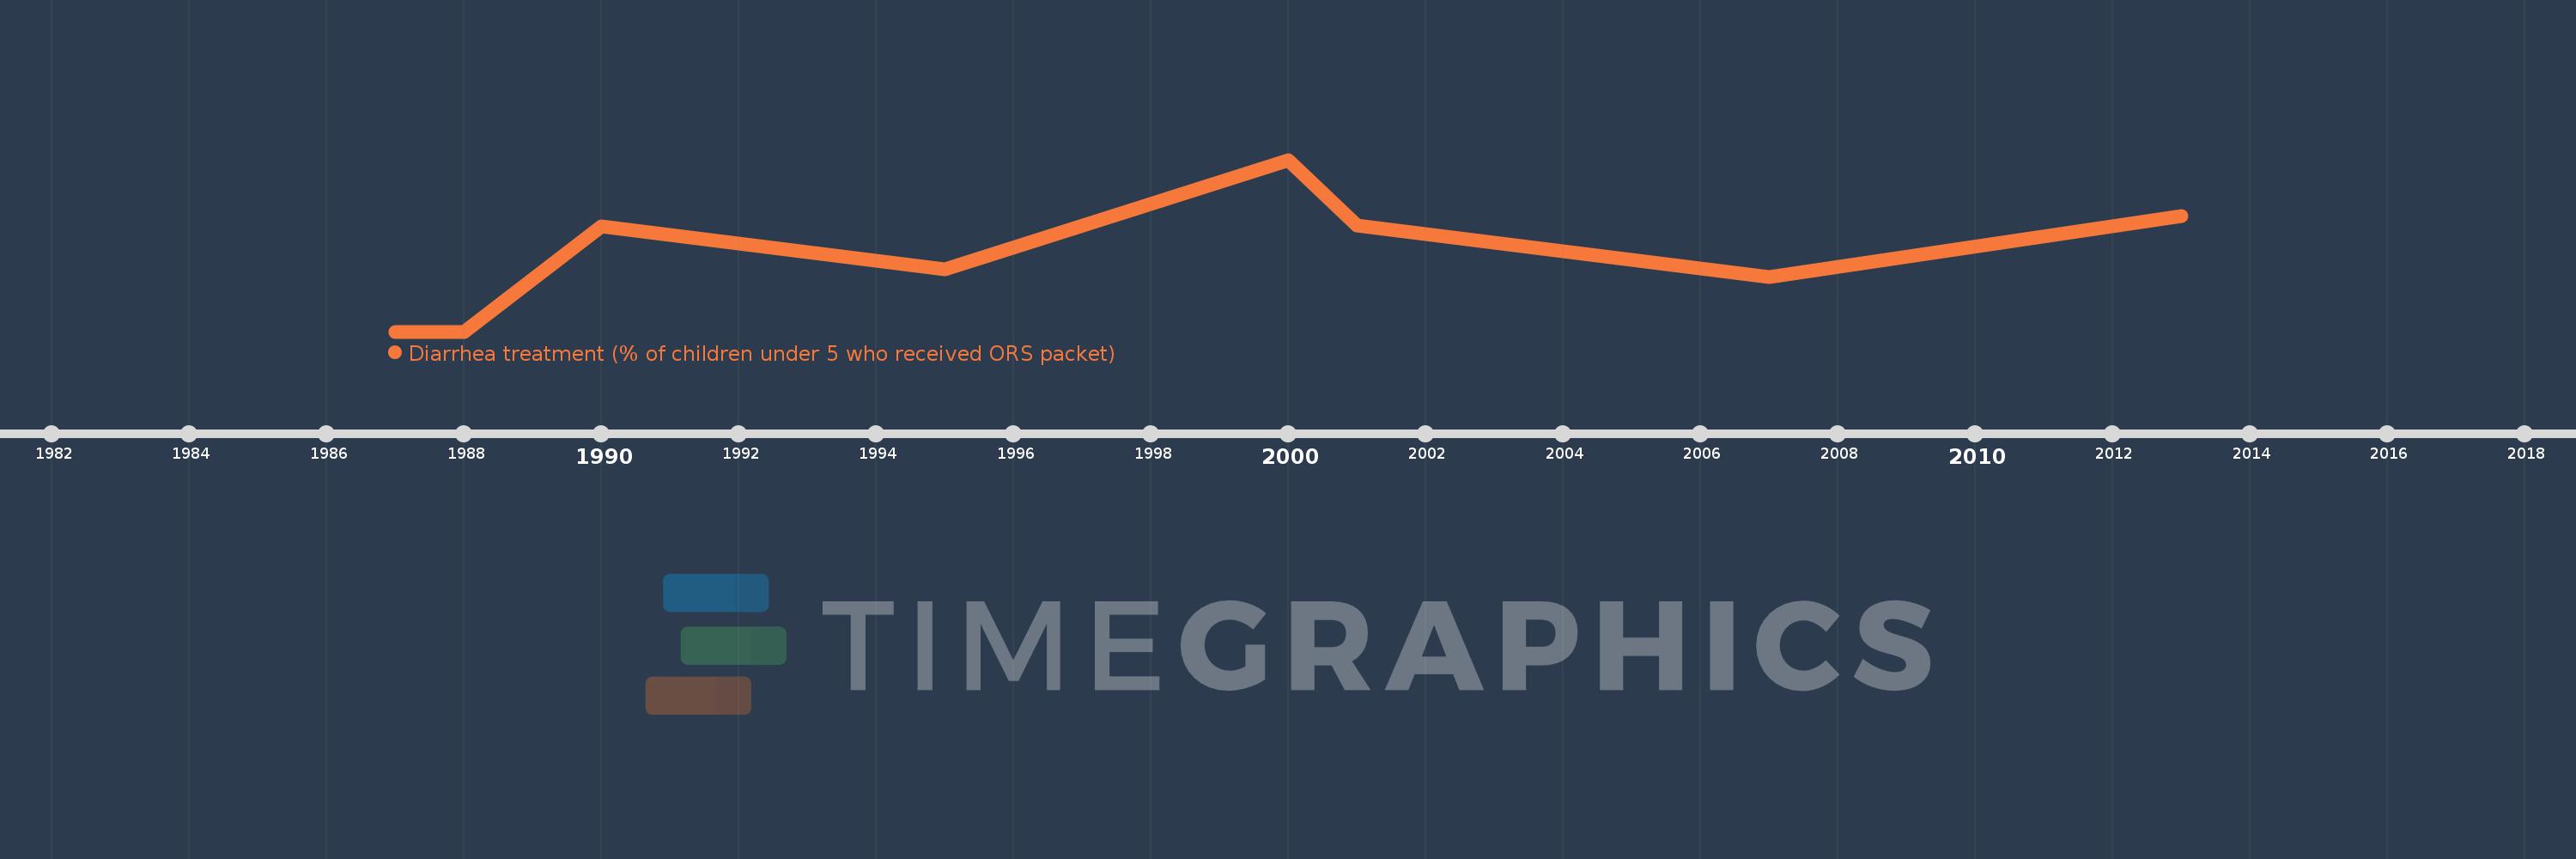
Diarrhea treatment (% of children under 5 who received ORS packet)
2013,2007,2001,2000,1995,1990,1988,1987
This statistics in other country:
Timeline:
This timeline shows a graph from 1987 to 2013 of Cote d'Ivoire. No data until 1986. Number of actual observations by date: 8.
Source name:
World Development Indicators
Source organization:
UNICEF, State of the World's Children, Childinfo, and Demographic and Health Surveys.
Categories, topics:
Health
Last updated:
apr 23, 2017
Indicators value changes by year
At the date of observation
Value
Absolute change
Change from previous value
jan 1, 1990
16.0
+12.0
300.0%
jan 1, 1995
11.1
-4.9
-30.63%
jan 1, 2000
23.6
+12.5
112.61%
jan 1, 2001
16.1
-7.5
-31.78%
jan 1, 2007
10.2
-5.9
-36.65%
jan 1, 2013
17.2
+7.0
68.63%
Ranking of countries by current statistics by years


Comments: