29
/
en
AIzaSyAYiBZKx7MnpbEhh9jyipgxe19OcubqV5w
April 1, 2024
78081
Bangladesh
BGD
true
2
1
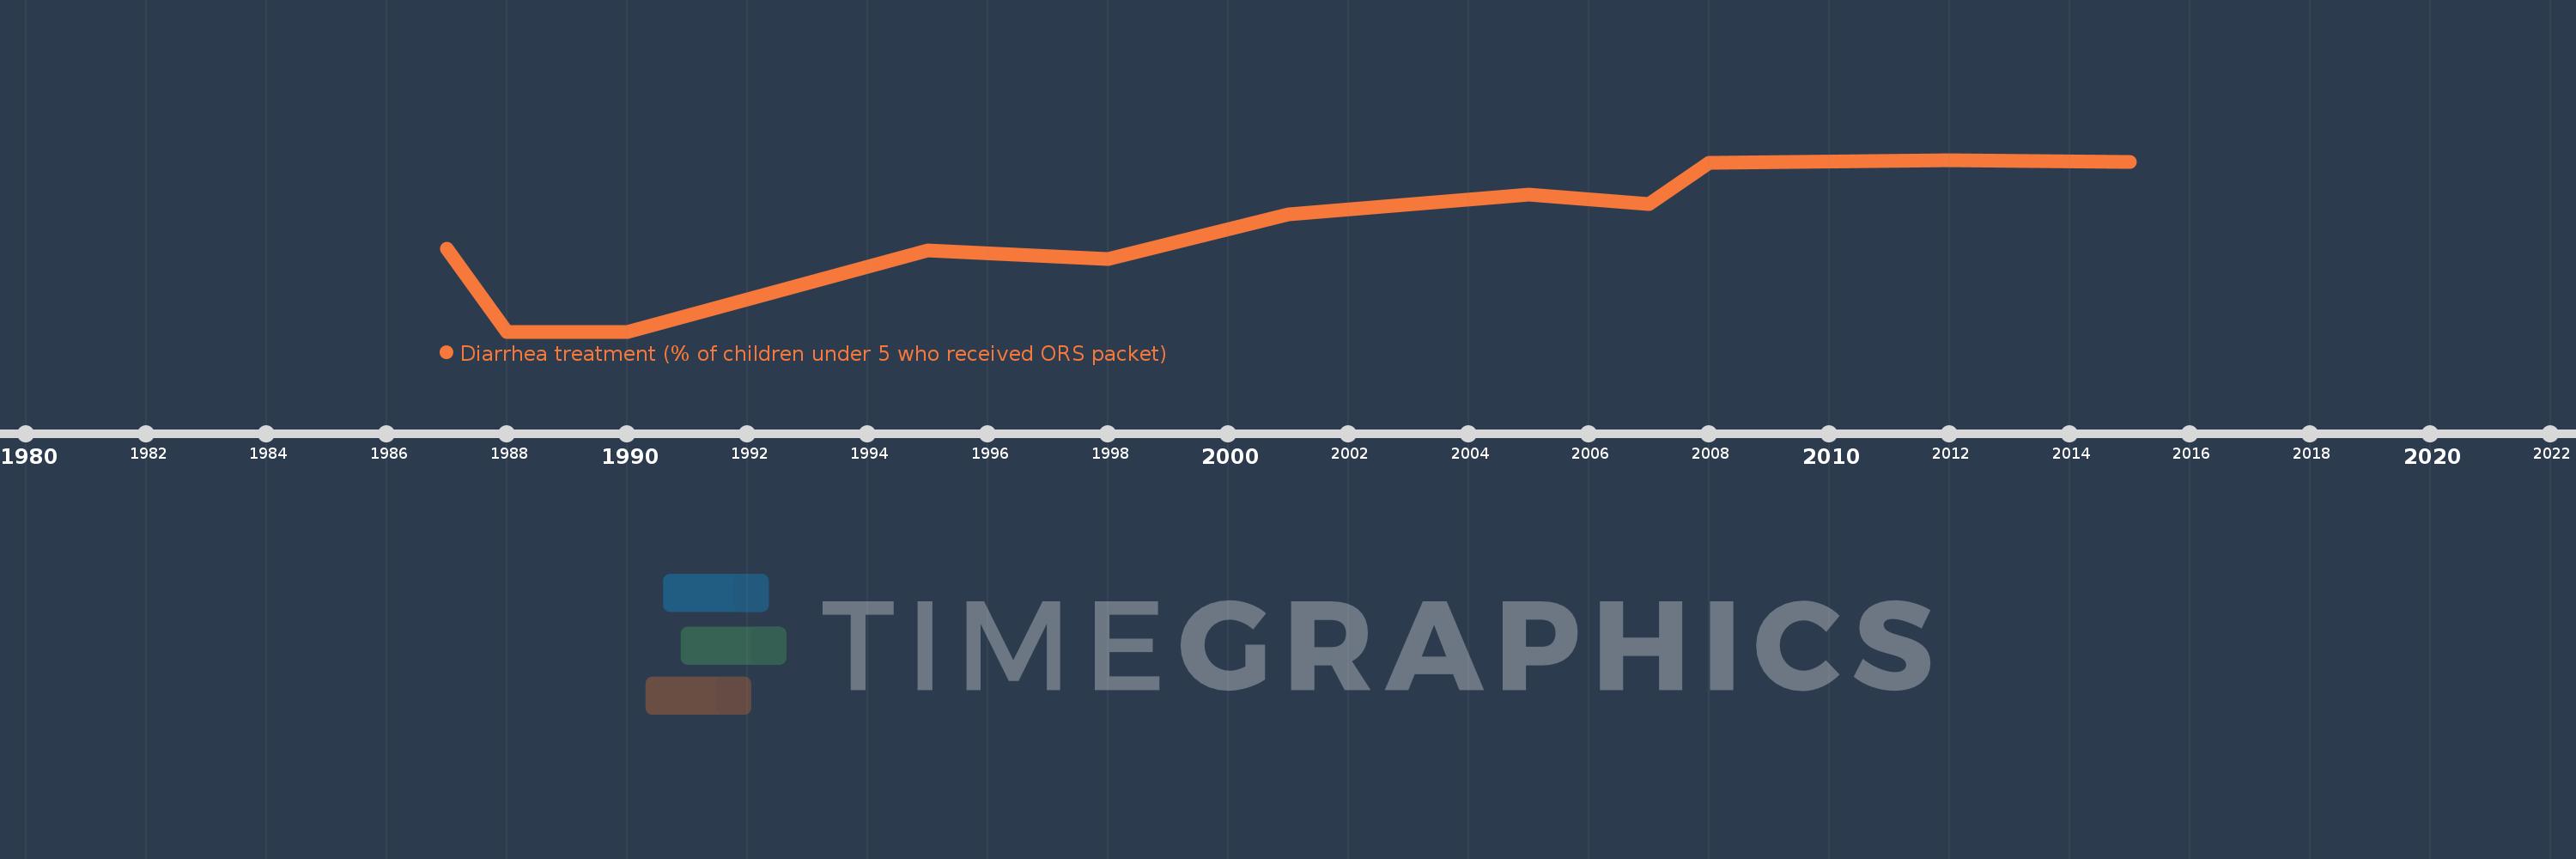
Diarrhea treatment (% of children under 5 who received ORS packet)
2015,2012,2008,2007,2005,2001,1998,1995,1990,1988,1987
This statistics in other country:
Timeline:
This timeline shows a graph from 1987 to 2015 of Bangladesh. No data until 1986. Number of actual observations by date: 11.
Source name:
World Development Indicators
Source organization:
UNICEF, State of the World's Children, Childinfo, and Demographic and Health Surveys.
Categories, topics:
Health
Last updated:
apr 23, 2017
Indicators value changes by year
At the date of observation
Value
Absolute change
Change from previous value
jan 1, 1987
51.0
+51.0
0.0%
jan 1, 1988
26.0
-25.0
-49.02%
jan 1, 1995
50.3
+24.3
93.46%
jan 1, 1998
47.9
-2.4
-4.77%
jan 1, 2001
61.3
+13.4
27.97%
jan 1, 2005
67.1
+5.8
9.46%
jan 1, 2007
64.37
-2.73
-4.07%
jan 1, 2008
76.6
+12.23
19.0%
jan 1, 2012
77.6
+1.0
1.31%
jan 1, 2015
77.0
-0.6
-0.77%
Ranking of countries by current statistics by years


Comments: