29
/
en
AIzaSyAYiBZKx7MnpbEhh9jyipgxe19OcubqV5w
April 1, 2024
195384
Mexico
MEX
true
2
1
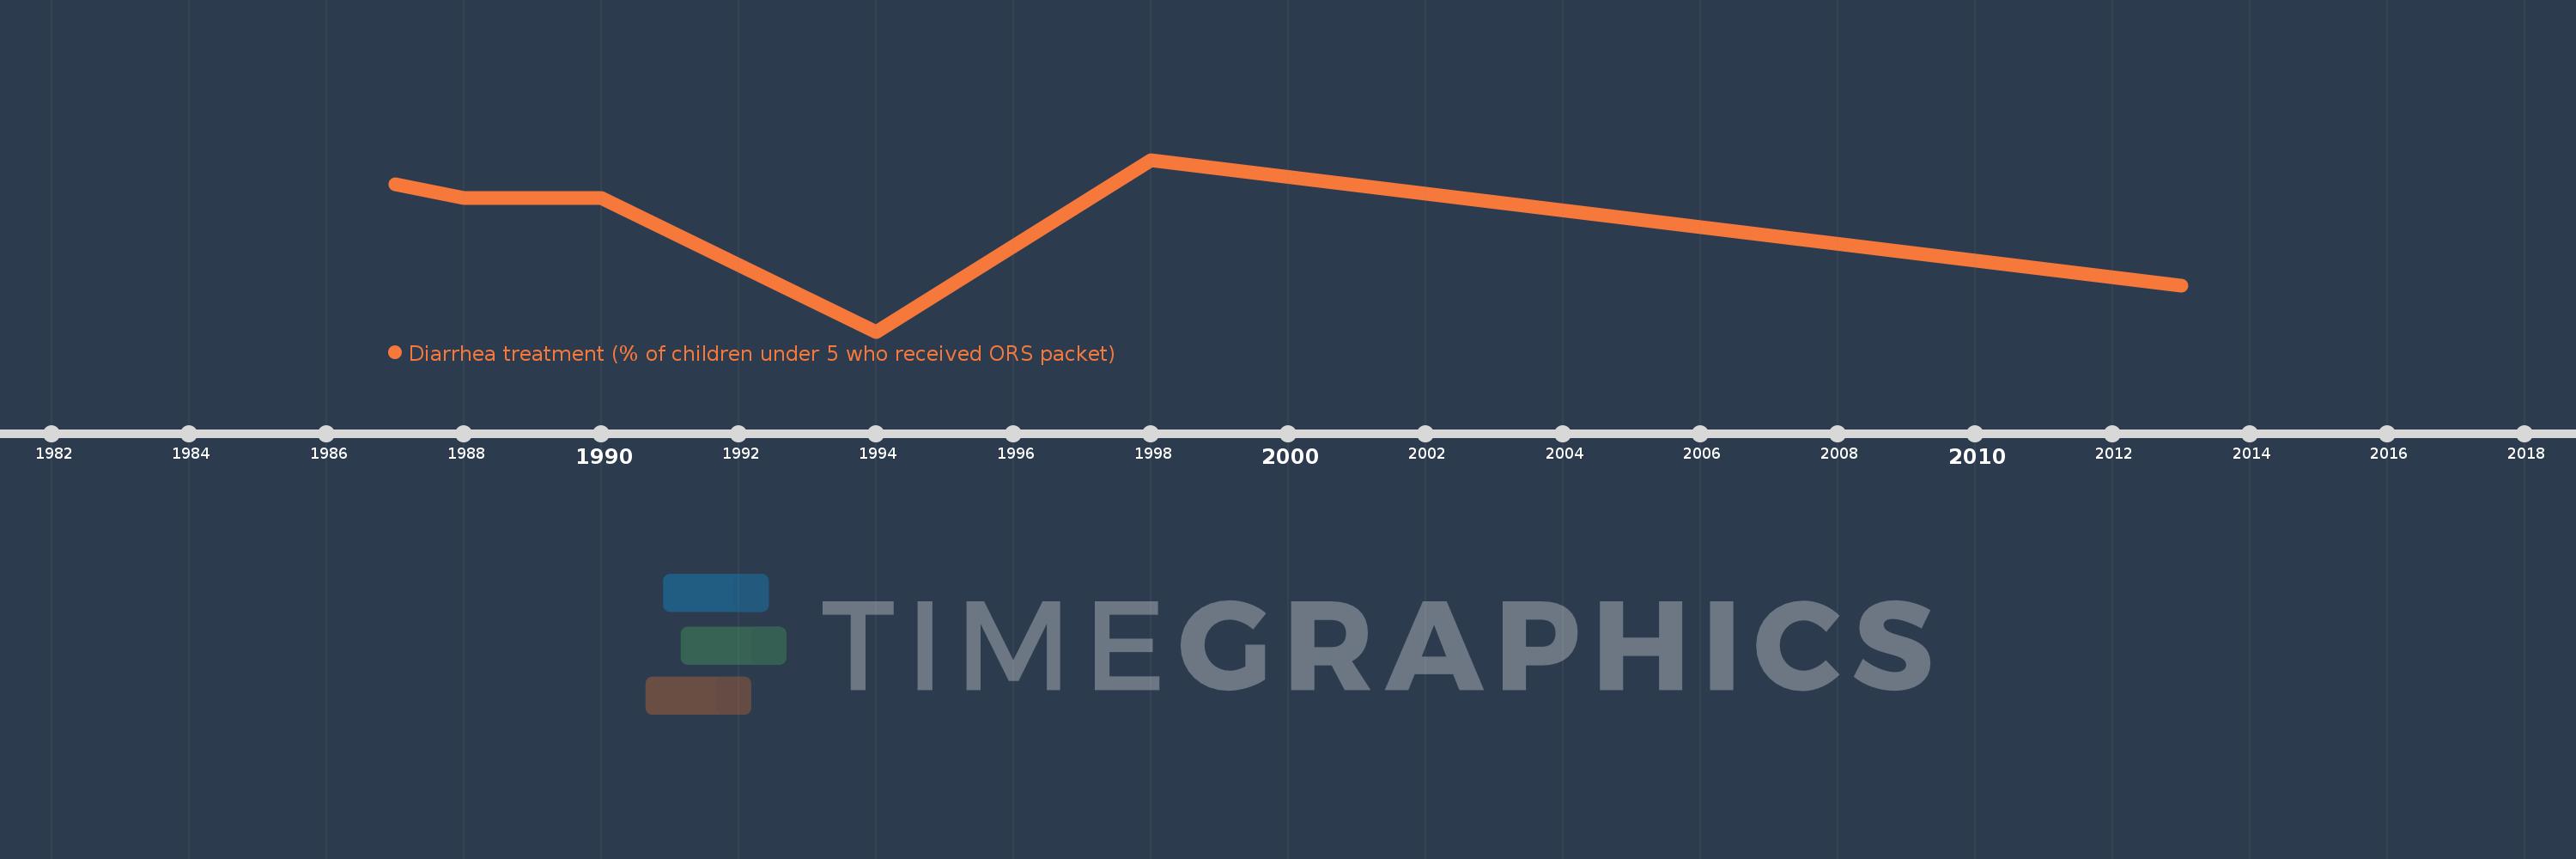
Diarrhea treatment (% of children under 5 who received ORS packet)
2013,1998,1994,1990,1988,1987
This statistics in other country:
Timeline:
This timeline shows a graph from 1987 to 2013 of Mexico. No data until 1986. Number of actual observations by date: 6.
Source name:
World Development Indicators
Source organization:
UNICEF, State of the World's Children, Childinfo, and Demographic and Health Surveys.
Categories, topics:
Health
Last updated:
apr 23, 2017
Indicators value changes by year
At the date of observation
Value
Absolute change
Change from previous value
jan 1, 1987
75.0
+75.0
0.0%
jan 1, 1988
72.0
-3.0
-4.0%
jan 1, 1994
41.9
-30.1
-41.81%
jan 1, 1998
80.5
+38.6
92.12%
jan 1, 2013
52.32
-28.18
-35.01%
Ranking of countries by current statistics by years


Comments: