29
/
en
AIzaSyAYiBZKx7MnpbEhh9jyipgxe19OcubqV5w
April 1, 2024
186366
Malawi
MWI
true
2
1
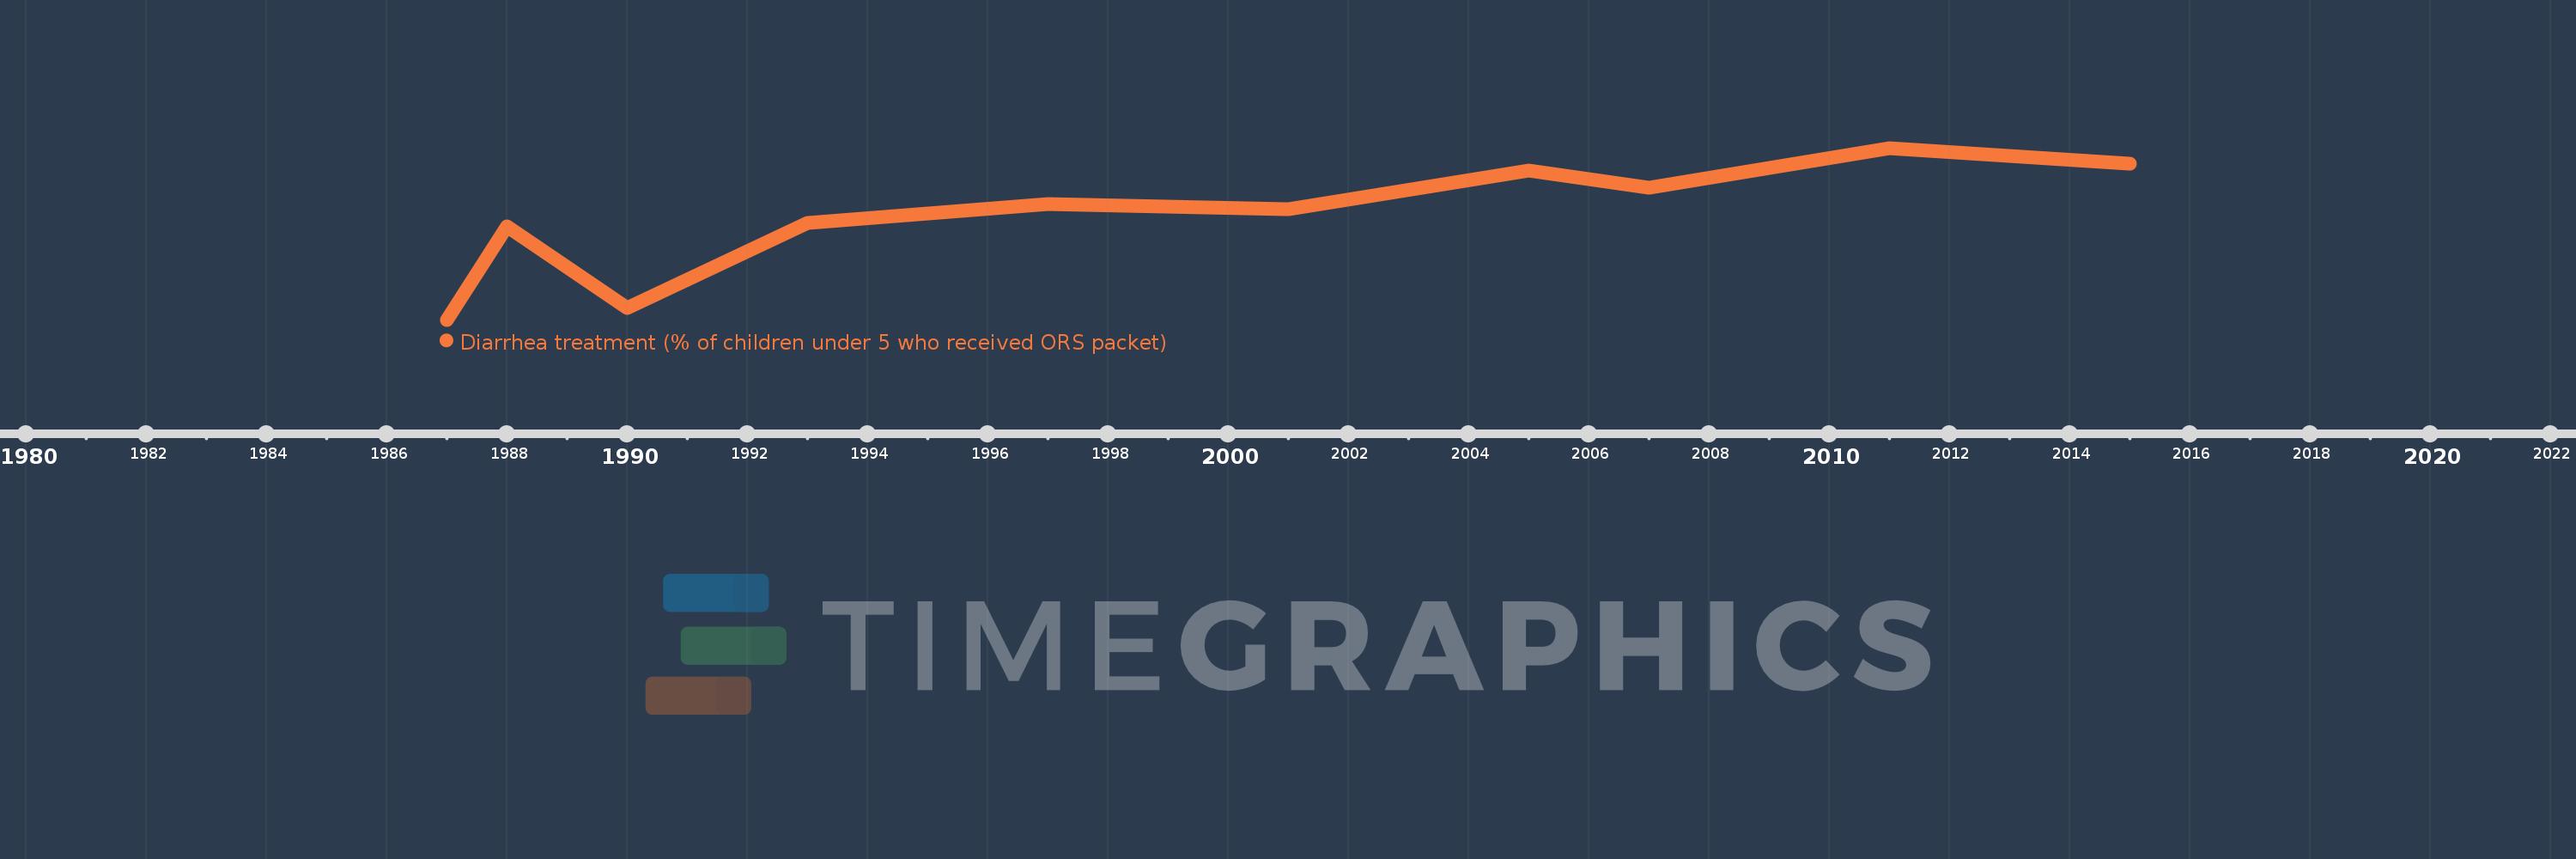
Diarrhea treatment (% of children under 5 who received ORS packet)
2015,2011,2007,2005,2001,1997,1993,1990,1988,1987
This statistics in other country:
Timeline:
This timeline shows a graph from 1987 to 2015 of Malawi. No data until 1986. Number of actual observations by date: 10.
Source name:
World Development Indicators
Source organization:
UNICEF, State of the World's Children, Childinfo, and Demographic and Health Surveys.
Categories, topics:
Health
Last updated:
apr 23, 2017
Indicators value changes by year
At the date of observation
Value
Absolute change
Change from previous value
jan 1, 1987
10.0
+10.0
0.0%
jan 1, 1988
42.0
+32.0
320.0%
jan 1, 1990
14.0
-28.0
-66.67%
jan 1, 1993
43.2
+29.2
208.57%
jan 1, 1997
49.7
+6.5
15.05%
jan 1, 2001
47.9
-1.8
-3.62%
jan 1, 2005
61.1
+13.2
27.56%
jan 1, 2007
55.246
-5.854
-9.58%
jan 1, 2011
69.0
+13.754
24.9%
jan 1, 2015
63.5
-5.5
-7.97%
Ranking of countries by current statistics by years


Comments: