29
/
en
AIzaSyAYiBZKx7MnpbEhh9jyipgxe19OcubqV5w
April 1, 2024
260723
Tanzania
TZA
true
2
1
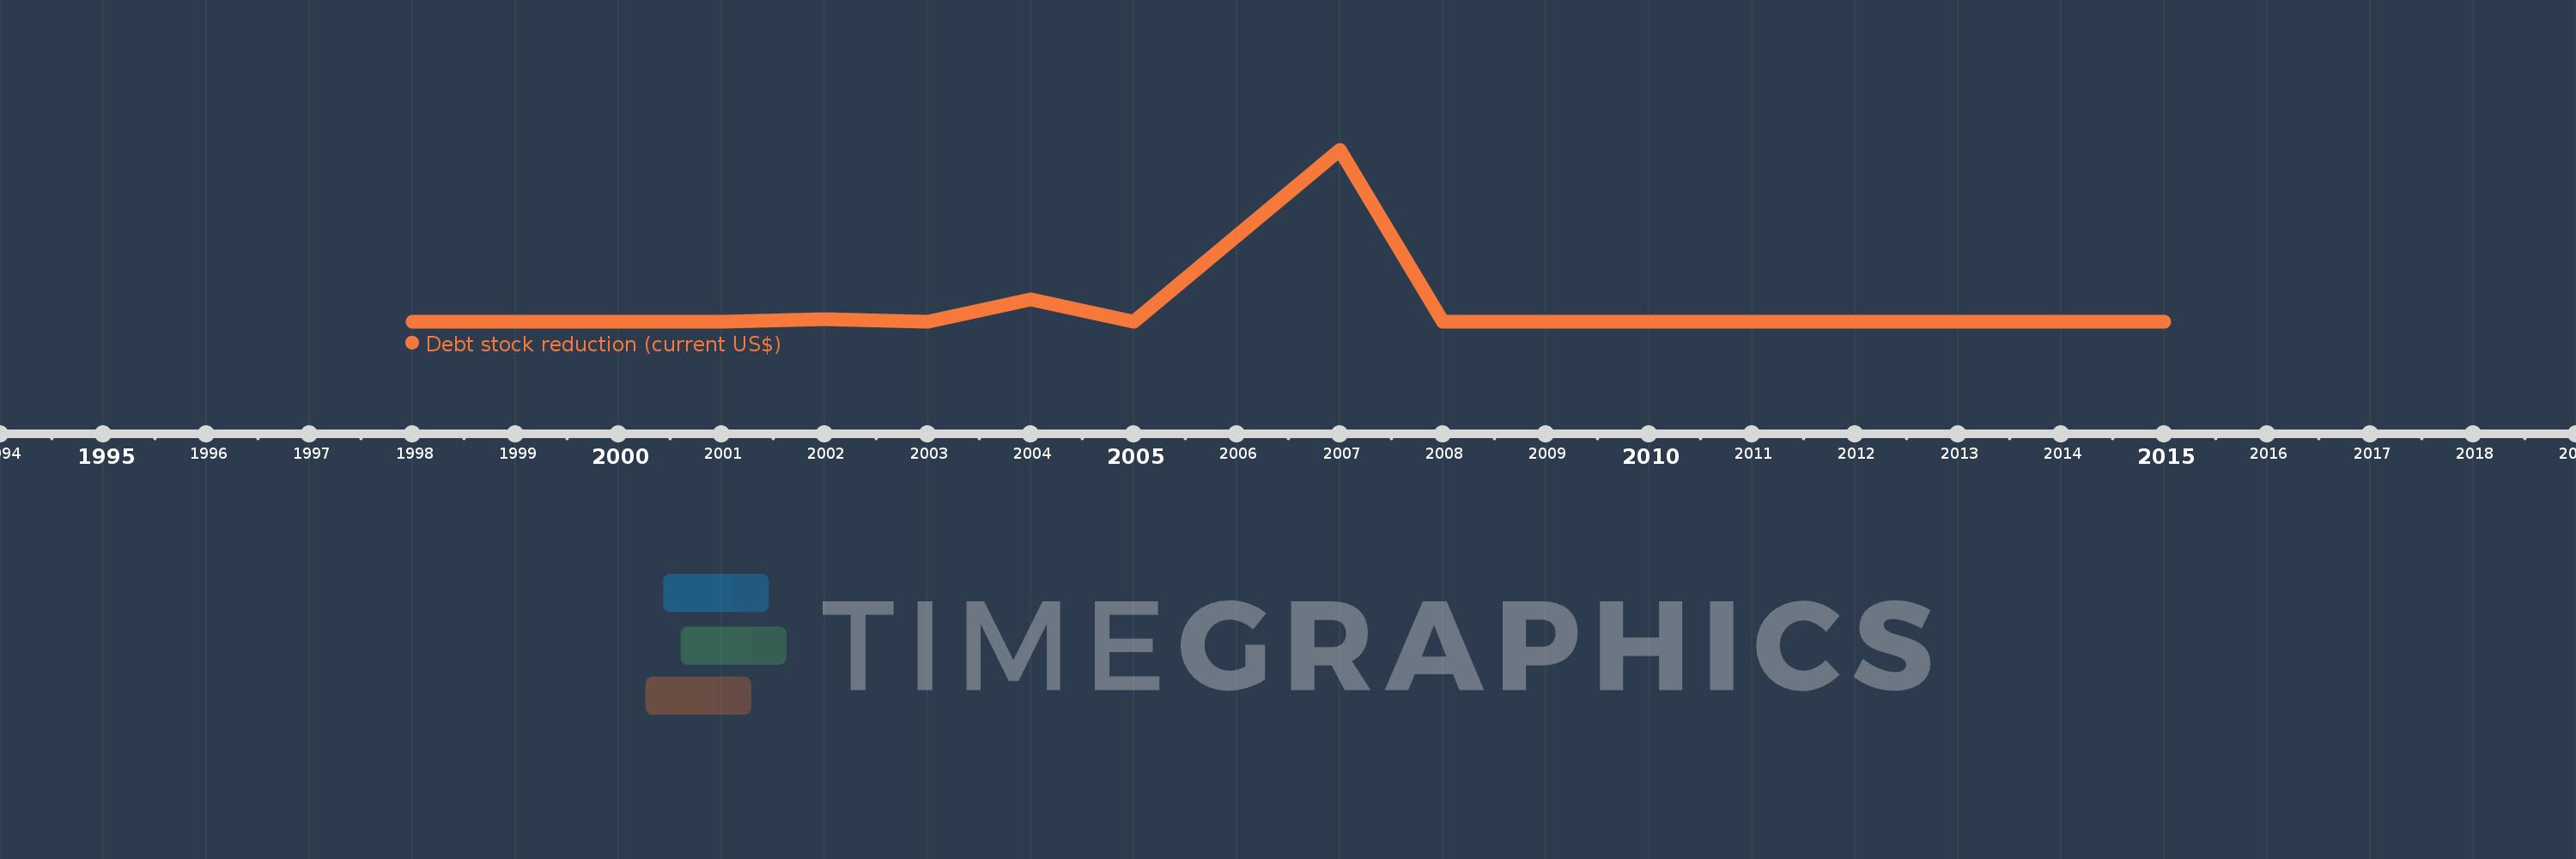
Debt stock reduction (current US$)
2015,2014,2011,2010,2008,2007,2005,2004,2003,2002,2001,1998
This statistics in other country:
Timeline:
This timeline shows a graph from 1998 to 2015 of Tanzania. No data until 1997. Number of actual observations by date: 12.
Source name:
World Development Indicators
Source organization:
World Bank, International Debt Statistics.
Categories, topics:
External Debt
Last updated:
apr 23, 2017
Indicators value changes by year
Maximum:
4.746 bln
jan 1, 2007
At the date of observation
Value
Absolute change
Change from previous value
jan 1, 1998
11.156 mln
+11.156 mln
0.0%
jan 1, 2001
2.7 mln
-8.456 mln
-75.8%
jan 1, 2002
69.236 mln
+66.536 mln
2.46K%
jan 1, 2003
294.0K
-68.942 mln
-99.58%
jan 1, 2004
619.8 mln
+619.506 mln
210.72K%
jan 1, 2005
222.0K
-619.578 mln
-99.96%
jan 1, 2007
4.746 bln
+4.745 bln
2.14 mln%
jan 1, 2008
1000.0
-4.746 bln
-100.0%
jan 1, 2010
0.0
-1000.0
-100.0%
jan 1, 2011
1.472 mln
+1.472 mln
%
jan 1, 2014
136.0K
-1.336 mln
-90.76%
jan 1, 2015
33.0K
-103.0K
-75.74%
Ranking of countries by current statistics by years


Comments: