This statistics in other country:
Timeline:
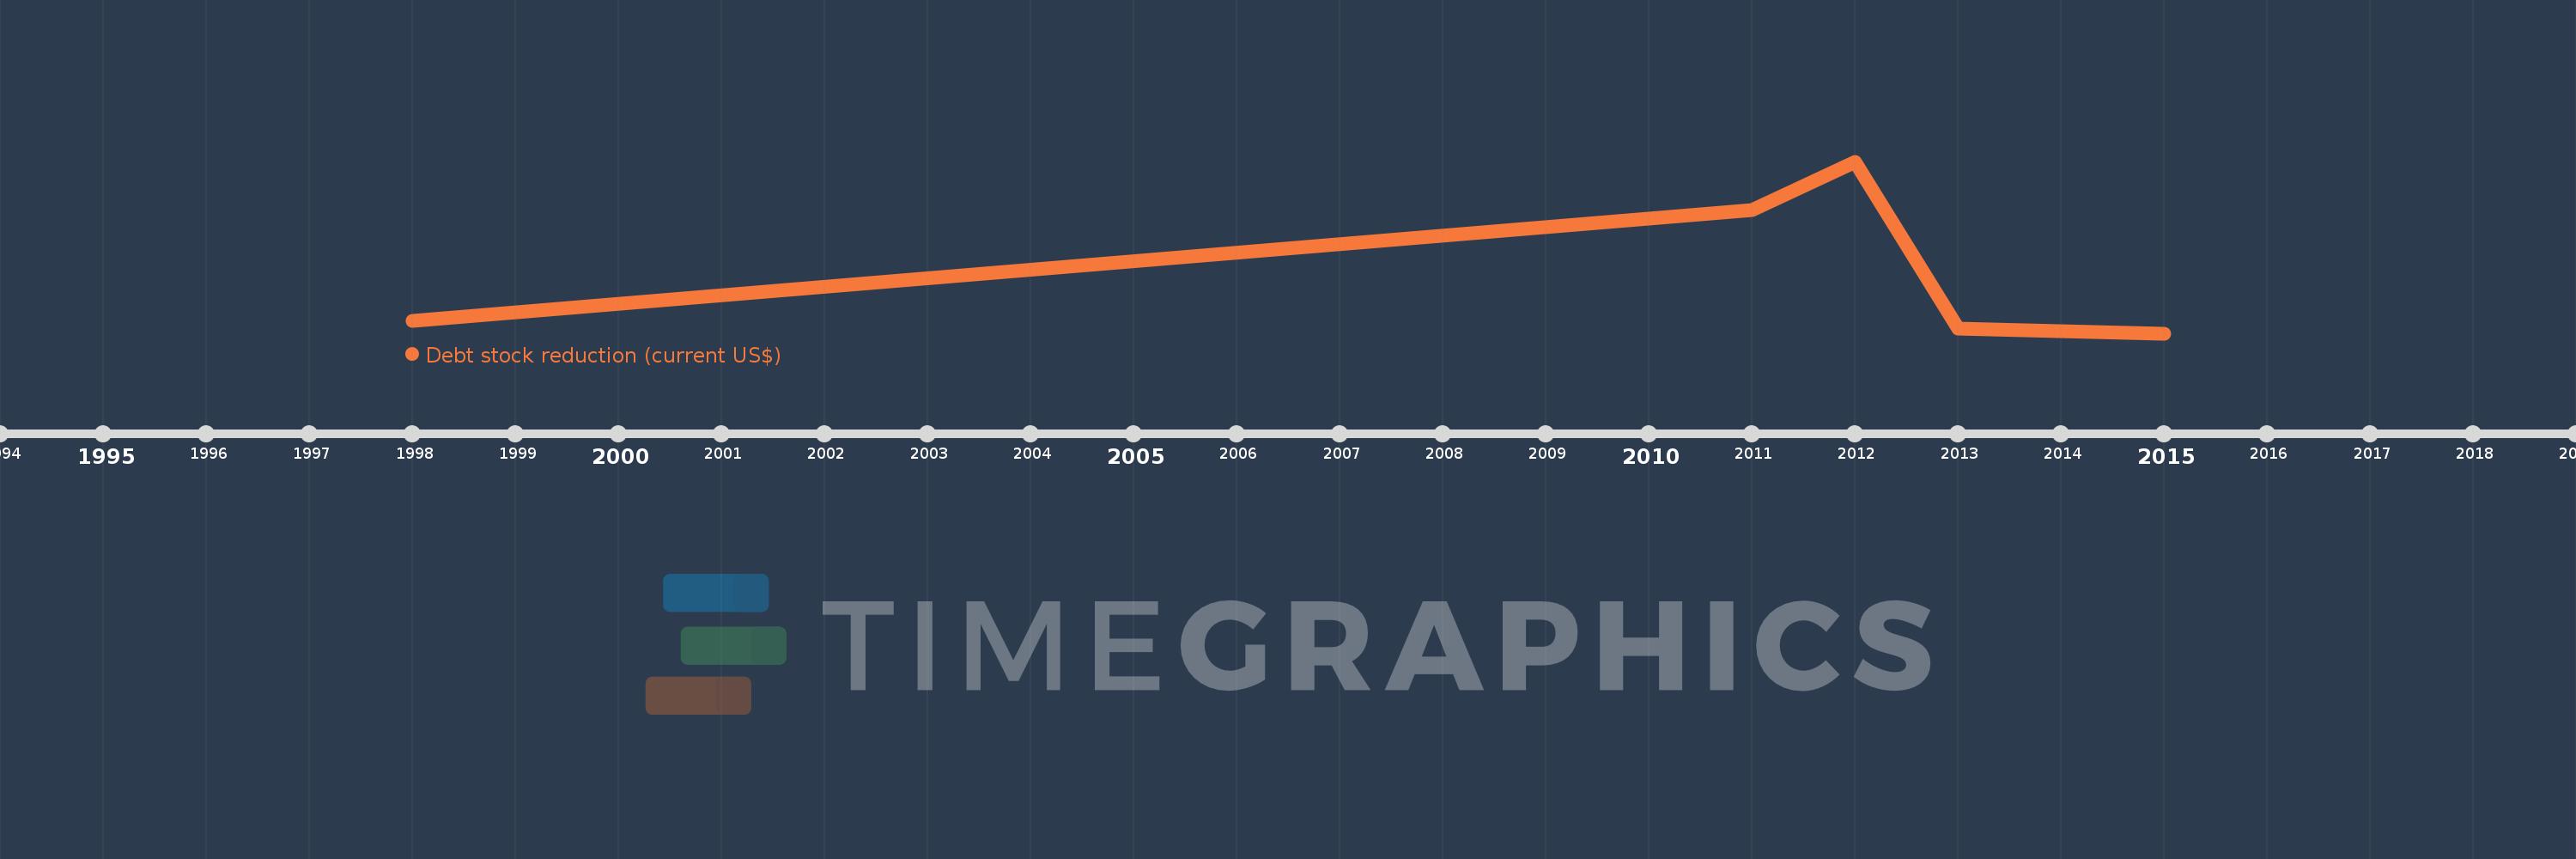
This timeline shows a graph from 1998 to 2015 of Togo. No data until 1997. Number of actual observations by date: 5.
Source name:
World Development Indicators
Source organization:
World Bank, International Debt Statistics.
Categories, topics:
External Debt
Last updated:
apr 23, 2017
Indicators value changes by year
Maximum:
683.561 mln
jan 1, 2012
At the date of observation
Value
Absolute change
Change from previous value
jan 1, 1998
48.528 mln
+48.528 mln
0.0%
jan 1, 2011
491.295 mln
+442.767 mln
912.39%
jan 1, 2012
683.561 mln
+192.266 mln
39.13%
jan 1, 2013
19.697 mln
-663.864 mln
-97.12%
jan 1, 2015
0.0
-19.697 mln
-100.0%
Ranking of countries by current statistics by years


Comments: