29
/
en
AIzaSyAYiBZKx7MnpbEhh9jyipgxe19OcubqV5w
April 1, 2024
212811
Nigeria
NGA
true
2
1
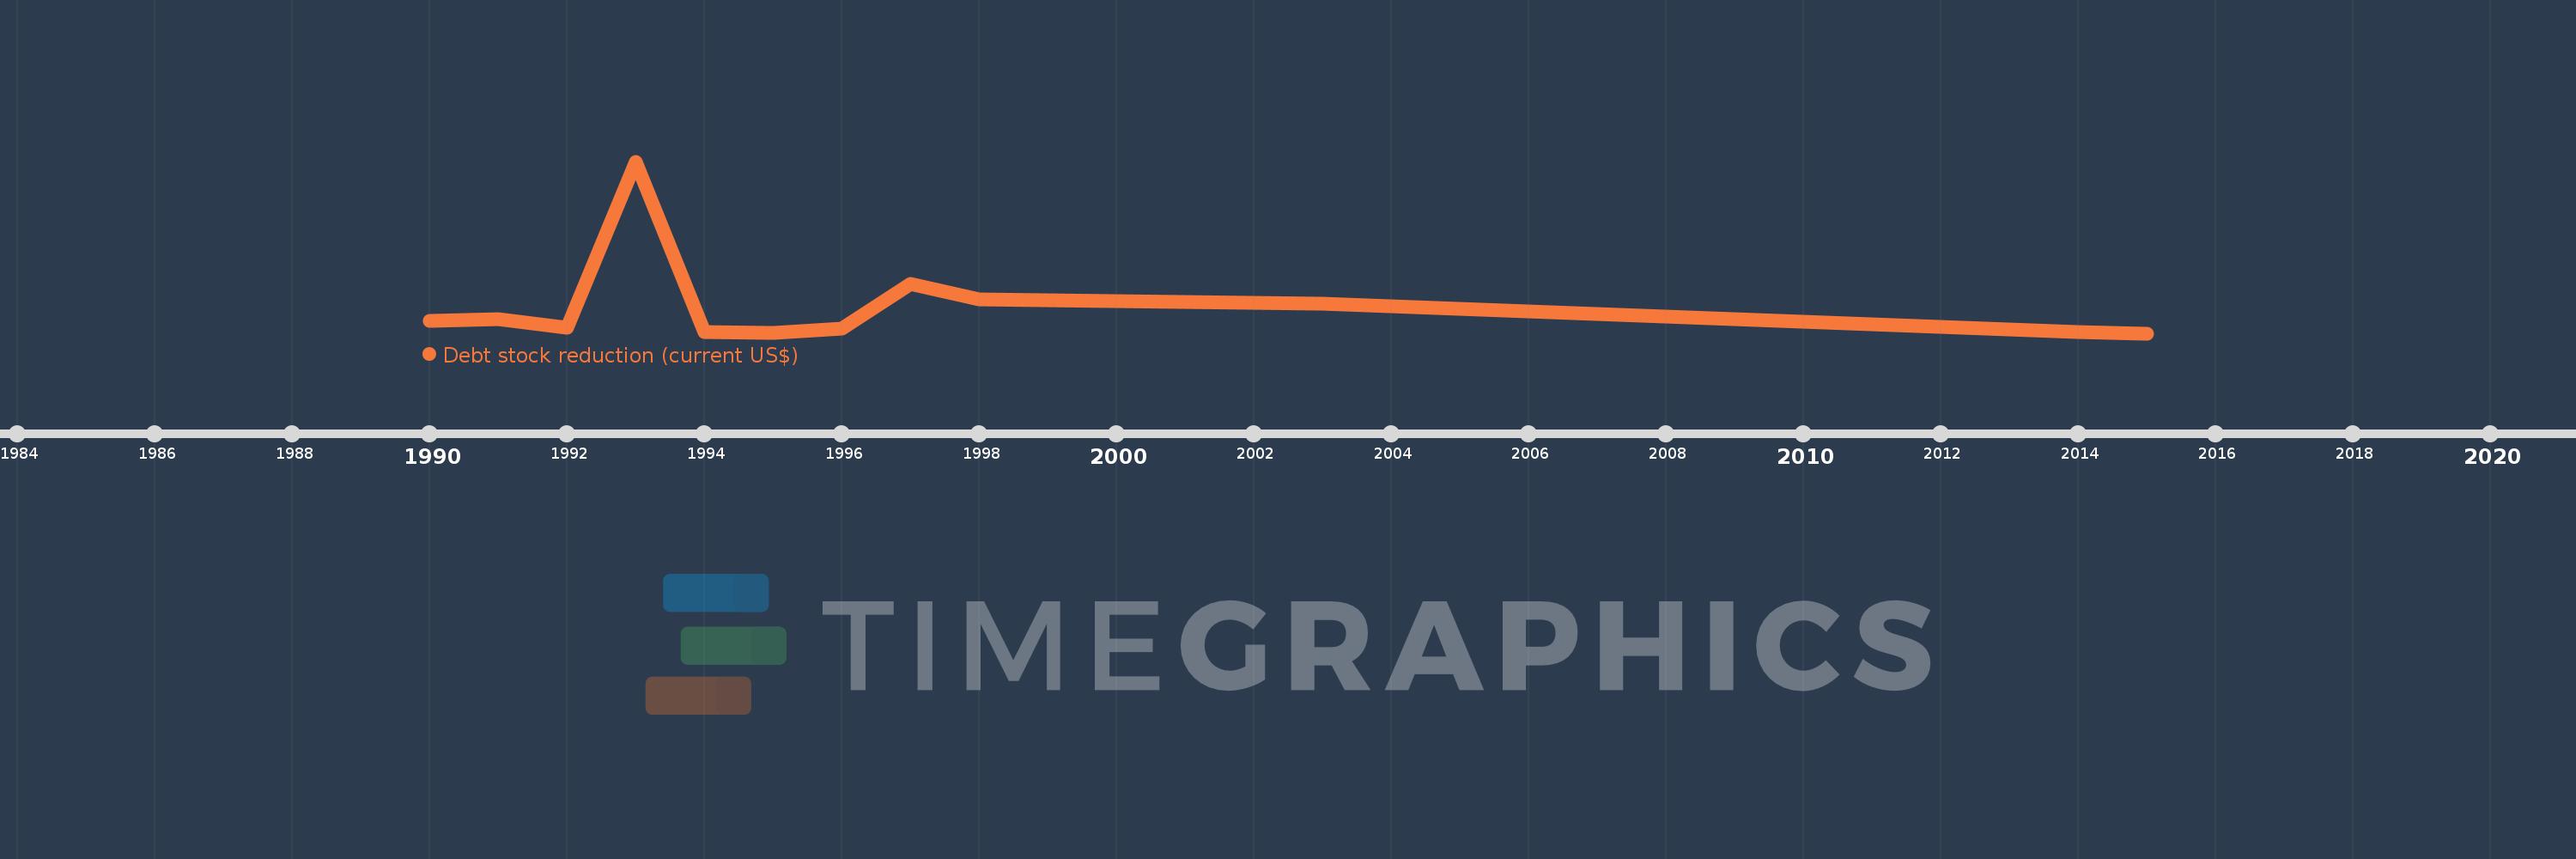
Debt stock reduction (current US$)
2015,2014,2003,1998,1997,1996,1995,1994,1993,1992,1991,1990
This statistics in other country:
Timeline:
This timeline shows a graph from 1990 to 2015 of Nigeria. No data until 1989. Number of actual observations by date: 12.
Source name:
World Development Indicators
Source organization:
World Bank, International Debt Statistics.
Categories, topics:
External Debt
Last updated:
apr 23, 2017
Indicators value changes by year
Maximum:
3.532 bln
jan 1, 1993
At the date of observation
Value
Absolute change
Change from previous value
jan 1, 1990
247.228 mln
+247.228 mln
0.0%
jan 1, 1991
286.239 mln
+39.011 mln
15.78%
jan 1, 1992
113.275 mln
-172.964 mln
-60.43%
jan 1, 1993
3.532 bln
+3.418 bln
3.02K%
jan 1, 1994
30.0 mln
-3.502 bln
-99.15%
jan 1, 1995
13.35 mln
-16.65 mln
-55.5%
jan 1, 1996
94.9 mln
+81.55 mln
610.86%
jan 1, 1997
1.023 bln
+927.614 mln
977.46%
jan 1, 1998
699.506 mln
-323.008 mln
-31.59%
jan 1, 2003
609.96 mln
-89.546 mln
-12.8%
jan 1, 2014
22.987 mln
-586.973 mln
-96.23%
jan 1, 2015
0.0
-22.987 mln
-100.0%
Ranking of countries by current statistics by years


Comments: