29
/
en
AIzaSyAYiBZKx7MnpbEhh9jyipgxe19OcubqV5w
April 1, 2024
211557
Niger
NER
true
2
1
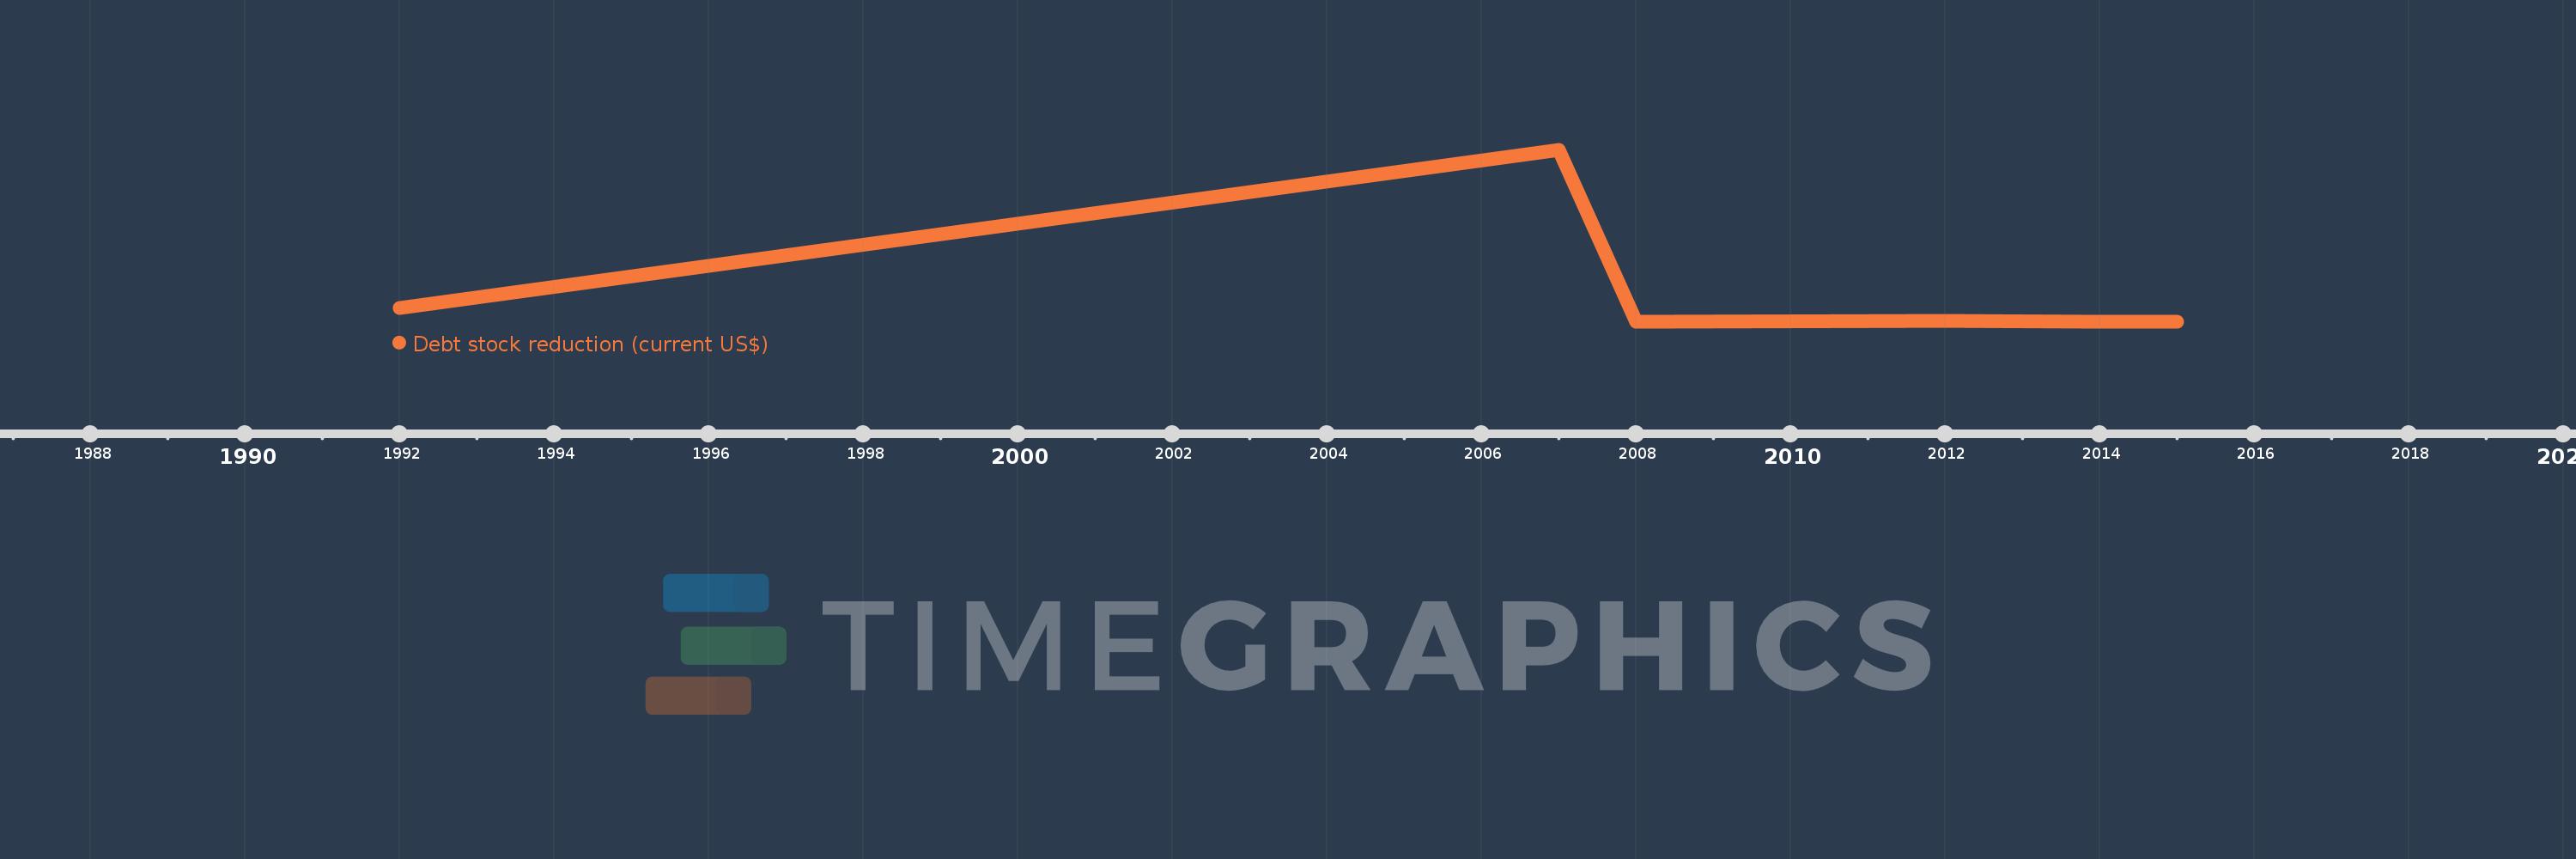
Debt stock reduction (current US$)
2015,2014,2012,2008,2007,1992
This statistics in other country:
Timeline:
This timeline shows a graph from 1992 to 2015 of Niger. No data until 1991. Number of actual observations by date: 6.
Source name:
World Development Indicators
Source organization:
World Bank, International Debt Statistics.
Categories, topics:
External Debt
Last updated:
apr 23, 2017
Indicators value changes by year
Maximum:
1.311 bln
jan 1, 2007
At the date of observation
Value
Absolute change
Change from previous value
jan 1, 1992
103.638 mln
+103.638 mln
0.0%
jan 1, 2007
1.311 bln
+1.207 bln
1.16K%
jan 1, 2008
1000.0
-1.311 bln
-100.0%
jan 1, 2012
7.253 mln
+7.252 mln
725.2K%
jan 1, 2014
0.0
-7.253 mln
-100.0%
Ranking of countries by current statistics by years


Comments: