29
/
en
AIzaSyAYiBZKx7MnpbEhh9jyipgxe19OcubqV5w
April 1, 2024
239156
Sierra Leone
SLE
true
2
1
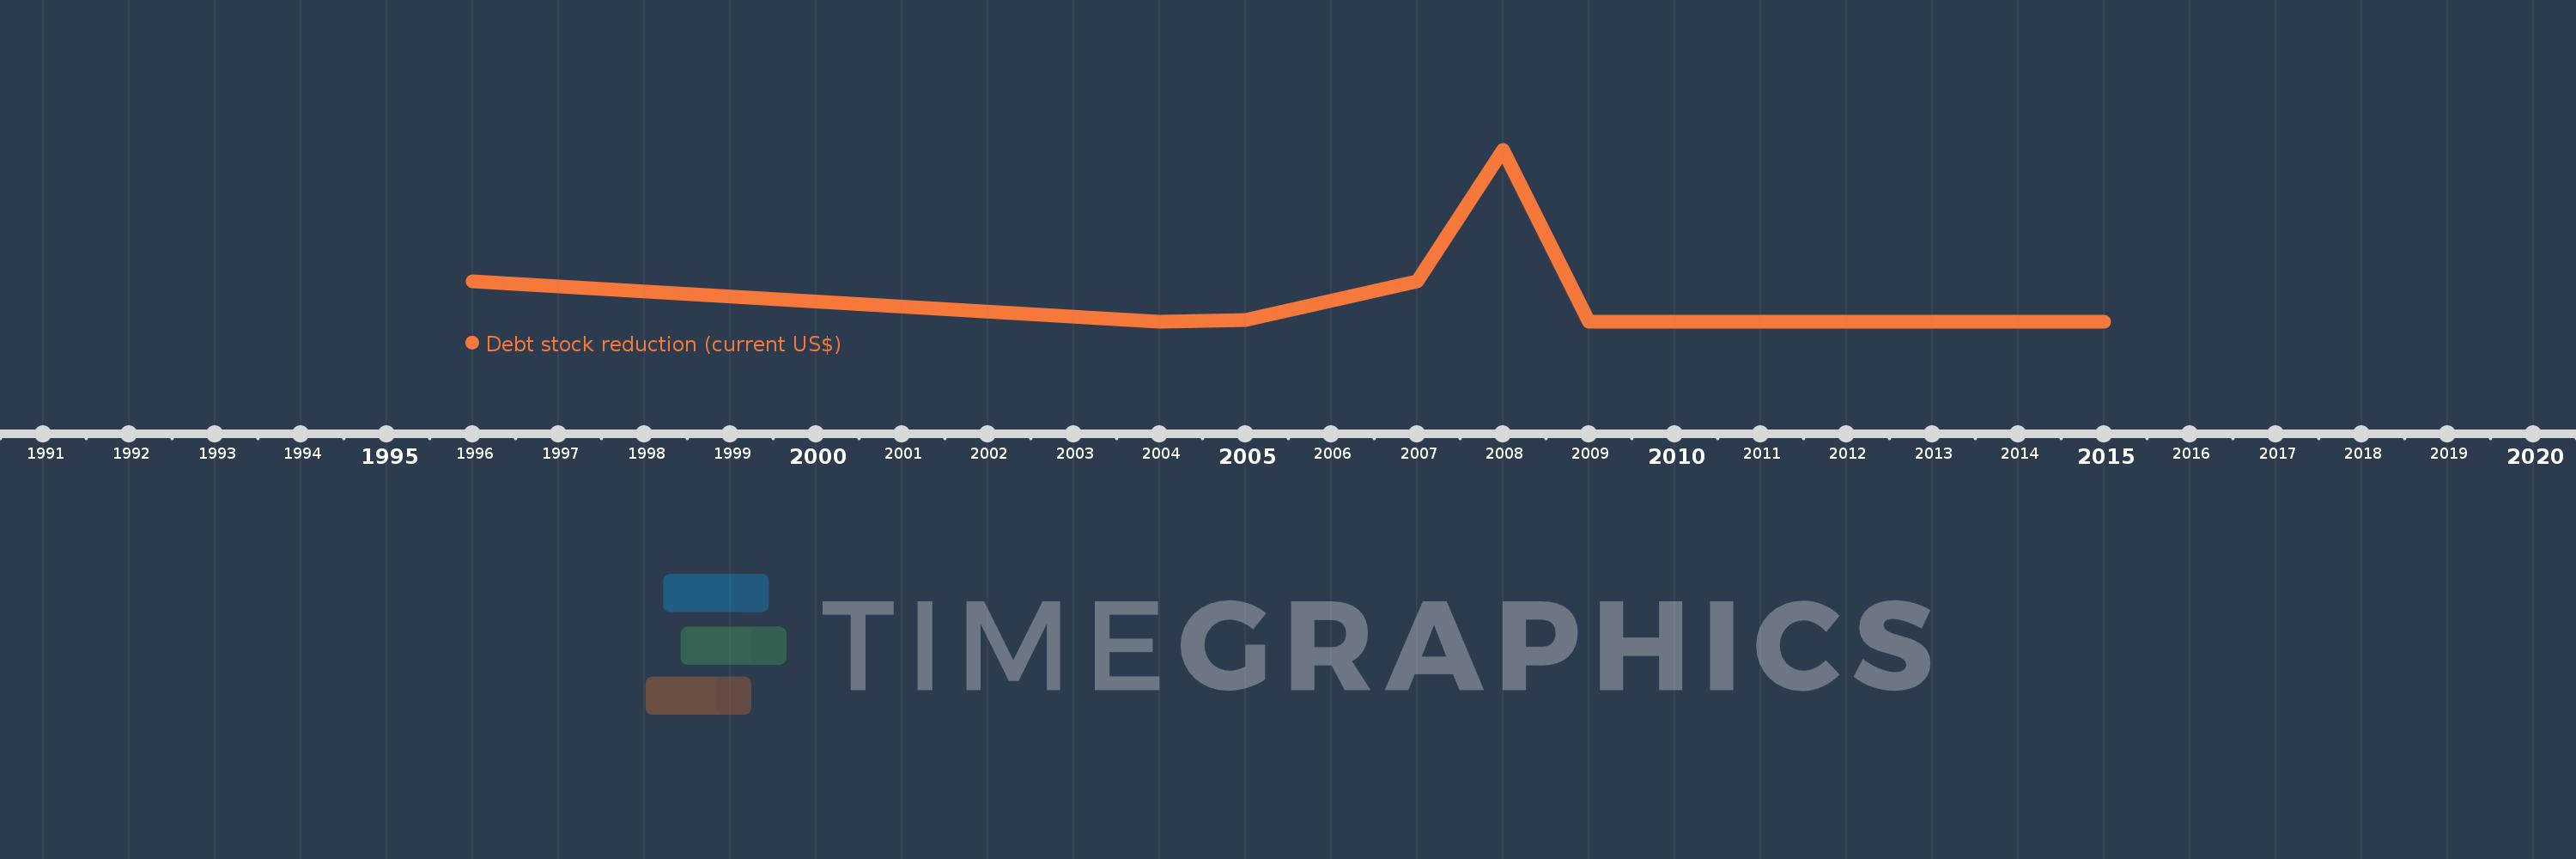
Debt stock reduction (current US$)
2015,2011,2009,2008,2007,2005,2004,1996
This statistics in other country:
Timeline:
This timeline shows a graph from 1996 to 2015 of Sierra Leone. No data until 1995. Number of actual observations by date: 8.
Source name:
World Development Indicators
Source organization:
World Bank, International Debt Statistics.
Categories, topics:
External Debt
Last updated:
apr 23, 2017
Indicators value changes by year
Maximum:
931.914 mln
jan 1, 2008
At the date of observation
Value
Absolute change
Change from previous value
jan 1, 1996
222.406 mln
+222.406 mln
0.0%
jan 1, 2004
1000.0
-222.405 mln
-100.0%
jan 1, 2005
10.245 mln
+10.244 mln
1.02 mln%
jan 1, 2007
221.878 mln
+211.633 mln
2.07K%
jan 1, 2008
931.914 mln
+710.036 mln
320.01%
jan 1, 2009
17.0K
-931.897 mln
-100.0%
jan 1, 2011
0.0
-17.0K
-100.0%
Ranking of countries by current statistics by years


Comments: