29
/
en
AIzaSyAYiBZKx7MnpbEhh9jyipgxe19OcubqV5w
April 1, 2024
257321
Switzerland
CHE
true
2
1
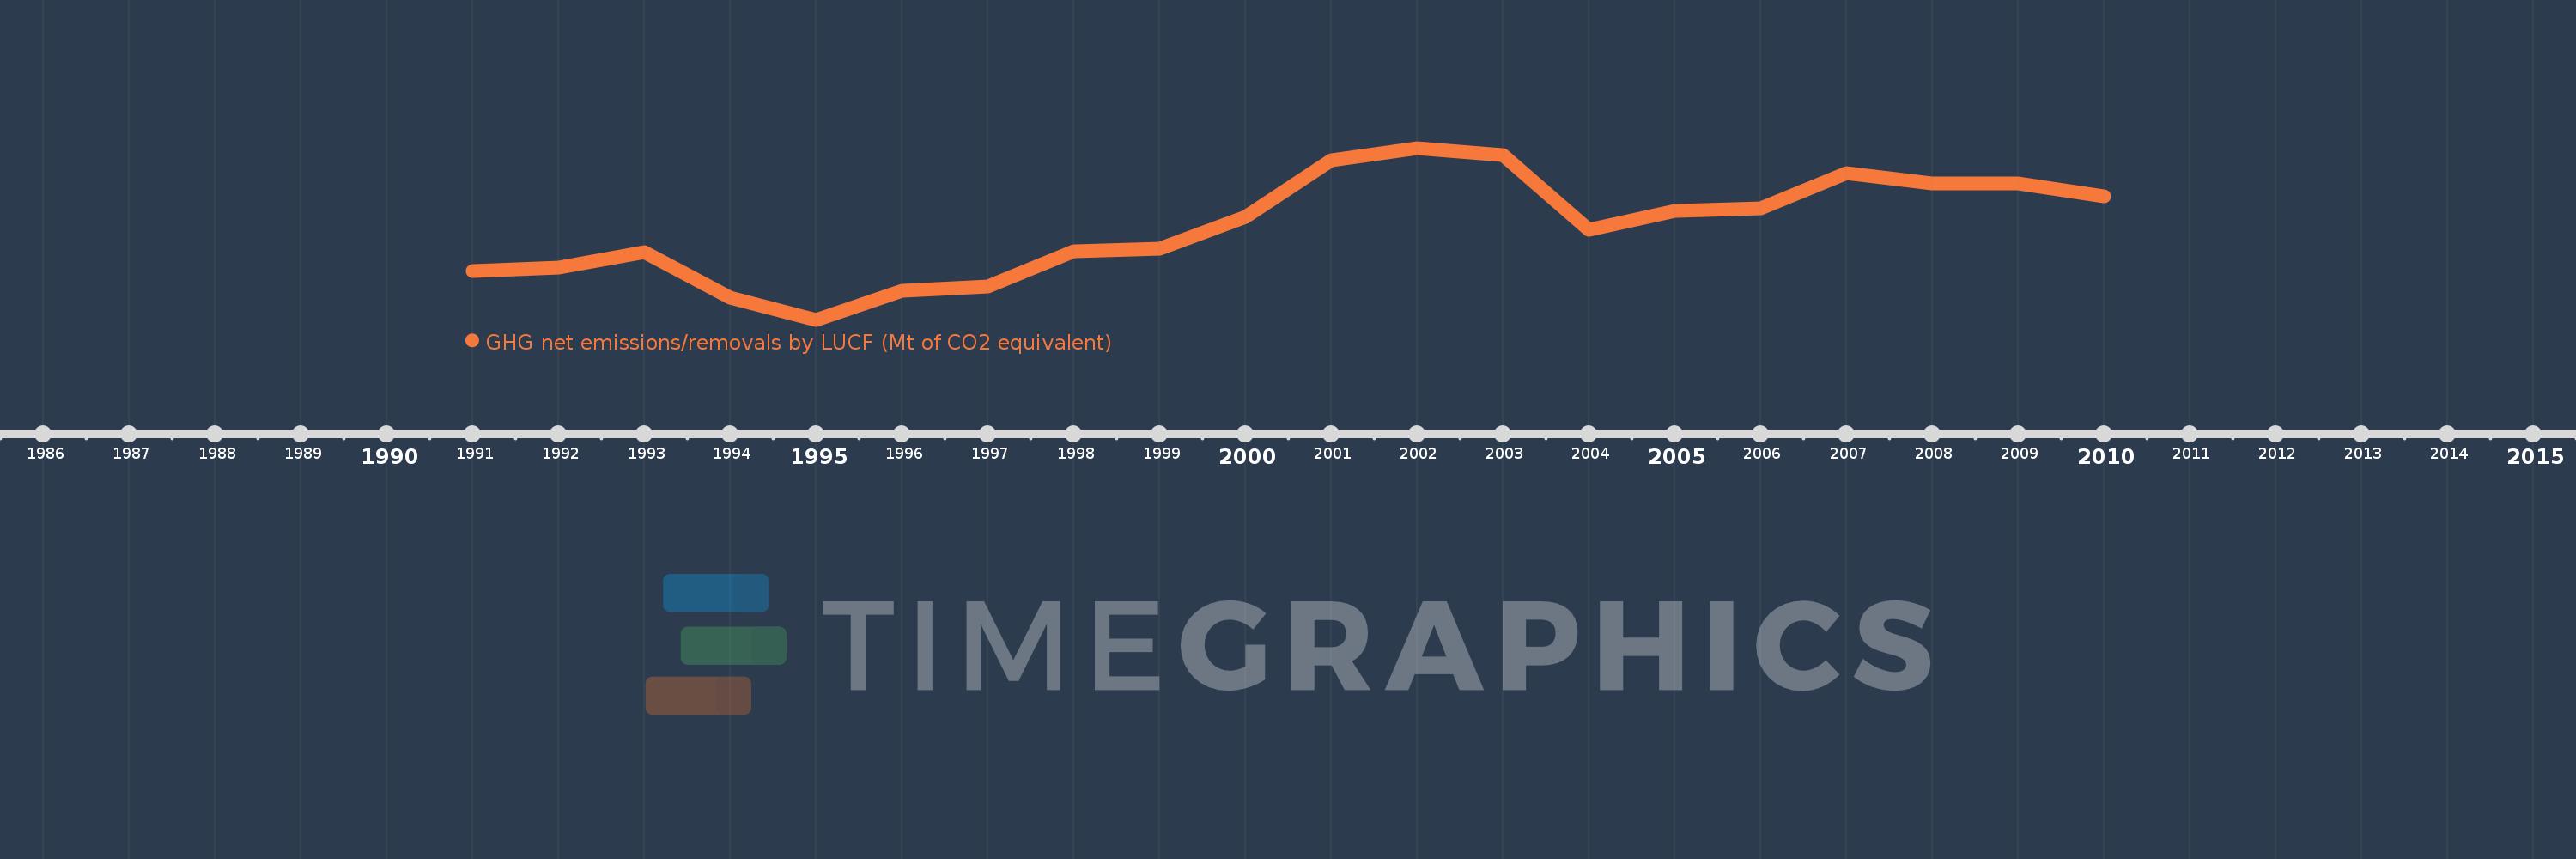
GHG net emissions/removals by LUCF (Mt of CO2 equivalent)
2010,2009,2008,2007,2006,2005,2004,2003,2002,2001,2000,1999,1998,1997,1996,1995,1994,1993,1992,1991
This statistics in other country:
AlbaniaAlgeriaAntigua and BarbudaArgentinaAustraliaAustriaAzerbaijanBangladeshBarbadosBelarusBelgiumBelizeBeninBhutanBoliviaBosnia and HerzegovinaBotswanaBrazilBulgariaBurkina FasoBurundiCabo VerdeCambodiaCameroonCanadaCentral African RepublicChadChileChinaColombiaComorosCongo, Dem. Rep.Congo, Rep.Costa RicaCote d'IvoireCroatiaCubaCzech RepublicDenmarkDjiboutiDominicaDominican RepublicEcuadorEgypt, Arab Rep.El SalvadorEritreaEstoniaEthiopiaFijiFinlandFranceGabonGambia, TheGeorgiaGermanyGhanaGreeceGrenadaGuatemalaGuineaGuyanaHaitiHondurasHungaryIcelandIndiaIndonesiaIran, Islamic Rep.IrelandIsraelItalyJamaicaJapanJordanKenyaKorea, Dem. People’s Rep.Korea, Rep.Kyrgyz RepublicLao PDRLatviaLebanonLesothoLiechtensteinLithuaniaLuxembourgMacedonia, FYRMadagascarMalawiMalaysiaMaliMaltaMauritaniaMauritiusMexicoMoldovaMonacoMongoliaMontenegroMoroccoMozambiqueNamibiaNauruNepalNetherlandsNew ZealandNicaraguaNigerNigeriaNorwayPakistanPanamaPapua New GuineaParaguayPeruPhilippinesPolandPortugalRomaniaRussian FederationRwandaSamoaSan MarinoSao Tome and PrincipeSaudi ArabiaSenegalSerbiaSeychellesSlovak RepublicSloveniaSouth AfricaSpainSri LankaSt. Kitts and NevisSt. LuciaSt. Vincent and the GrenadinesSudanSurinameSwazilandSwedenSwitzerlandTajikistanTanzaniaThailandTogoTongaTrinidad and TobagoTunisiaTurkeyTurkmenistanUgandaUkraineUnited Arab EmiratesUnited KingdomUnited StatesUruguayUzbekistanVanuatuVenezuela, RBVietnamYemen, Rep.ZambiaZimbabwe Timeline:
This timeline shows a graph from 1991 to 2010 of Switzerland. No data until 1990. Number of actual observations by date: 20.
Source name:
World Development Indicators
Source organization:
United Nations Framework Convention on Climate Change.
Categories, topics:
Climate Change, Environment
Last updated:
apr 23, 2017
Indicators value changes by year
Minimum:
-4.539
jan 1, 1995
At the date of observation
Value
Absolute change
Change from previous value
jan 1, 1991
-2.725
-2.725
0.0%
jan 1, 1992
-2.589
+0.136
-4.98%
jan 1, 1993
-2.009
+0.581
-22.43%
jan 1, 1994
-3.703
-1.695
84.37%
jan 1, 1995
-4.539
-0.835
22.56%
jan 1, 1996
-3.461
+1.078
-23.75%
jan 1, 1997
-3.296
+0.165
-4.77%
jan 1, 1998
-1.99
+1.306
-39.62%
jan 1, 1999
-1.888
+0.102
-5.14%
jan 1, 2000
-0.704
+1.183
-62.68%
jan 1, 2001
1.442
+2.146
-304.7%
jan 1, 2002
1.894
+0.452
31.38%
jan 1, 2003
1.634
-0.261
-13.75%
jan 1, 2004
-1.168
-2.801
-171.46%
jan 1, 2005
-0.454
+0.713
-61.1%
jan 1, 2006
-0.373
+0.081
-17.82%
jan 1, 2007
0.952
+1.325
-355.08%
jan 1, 2008
0.569
-0.383
-40.26%
jan 1, 2009
0.574
+0.005
0.93%
jan 1, 2010
0.089
-0.486
-84.58%
Ranking of countries by current statistics by years


Comments: