29
/
en
AIzaSyAYiBZKx7MnpbEhh9jyipgxe19OcubqV5w
April 1, 2024
180589
Liechtenstein
LIE
true
2
1
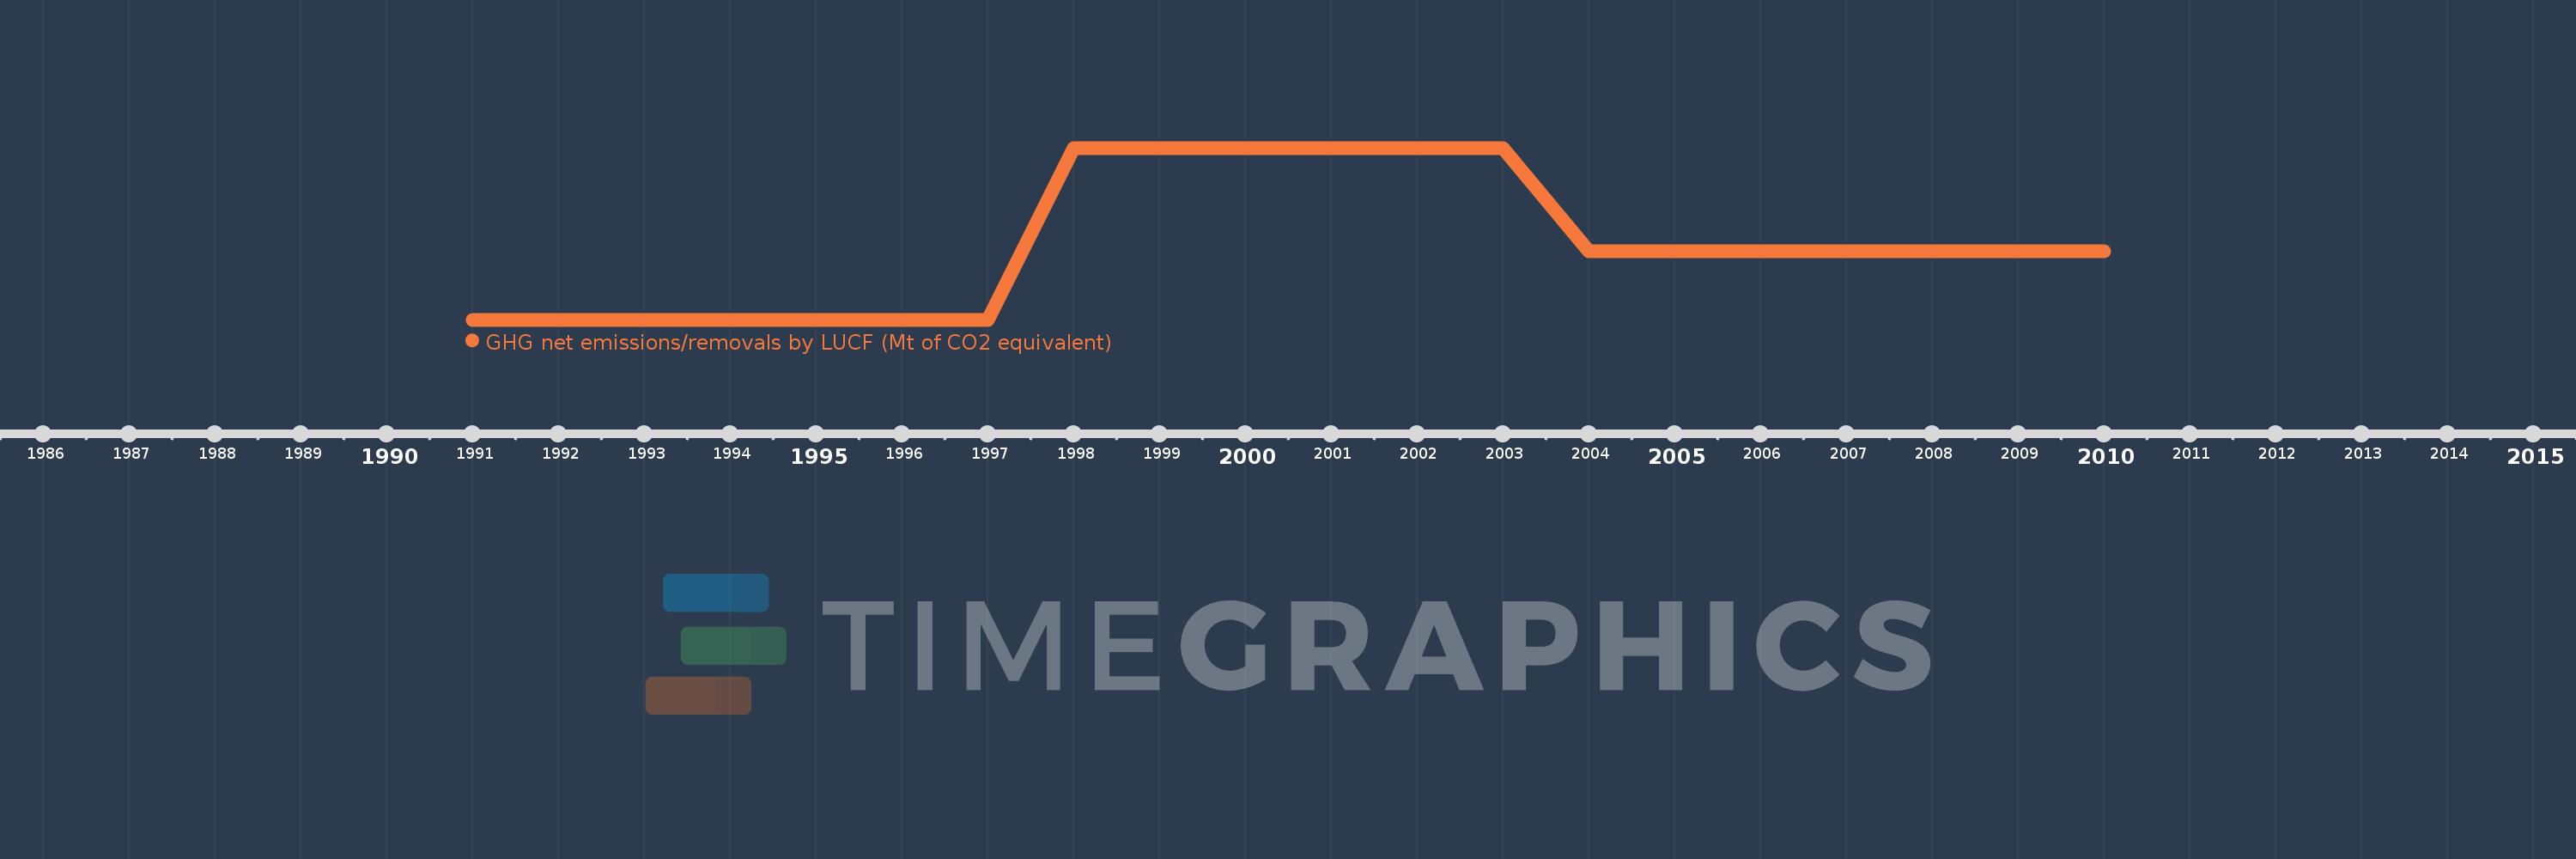
GHG net emissions/removals by LUCF (Mt of CO2 equivalent)
2010,2009,2008,2007,2006,2005,2004,2003,2002,2001,2000,1999,1998,1997,1996,1995,1994,1993,1992,1991
This statistics in other country:
AlbaniaAlgeriaAntigua and BarbudaArgentinaAustraliaAustriaAzerbaijanBangladeshBarbadosBelarusBelgiumBelizeBeninBhutanBoliviaBosnia and HerzegovinaBotswanaBrazilBulgariaBurkina FasoBurundiCabo VerdeCambodiaCameroonCanadaCentral African RepublicChadChileChinaColombiaComorosCongo, Dem. Rep.Congo, Rep.Costa RicaCote d'IvoireCroatiaCubaCzech RepublicDenmarkDjiboutiDominicaDominican RepublicEcuadorEgypt, Arab Rep.El SalvadorEritreaEstoniaEthiopiaFijiFinlandFranceGabonGambia, TheGeorgiaGermanyGhanaGreeceGrenadaGuatemalaGuineaGuyanaHaitiHondurasHungaryIcelandIndiaIndonesiaIran, Islamic Rep.IrelandIsraelItalyJamaicaJapanJordanKenyaKorea, Dem. People’s Rep.Korea, Rep.Kyrgyz RepublicLao PDRLatviaLebanonLesothoLiechtensteinLithuaniaLuxembourgMacedonia, FYRMadagascarMalawiMalaysiaMaliMaltaMauritaniaMauritiusMexicoMoldovaMonacoMongoliaMontenegroMoroccoMozambiqueNamibiaNauruNepalNetherlandsNew ZealandNicaraguaNigerNigeriaNorwayPakistanPanamaPapua New GuineaParaguayPeruPhilippinesPolandPortugalRomaniaRussian FederationRwandaSamoaSan MarinoSao Tome and PrincipeSaudi ArabiaSenegalSerbiaSeychellesSlovak RepublicSloveniaSouth AfricaSpainSri LankaSt. Kitts and NevisSt. LuciaSt. Vincent and the GrenadinesSudanSurinameSwazilandSwedenSwitzerlandTajikistanTanzaniaThailandTogoTongaTrinidad and TobagoTunisiaTurkeyTurkmenistanUgandaUkraineUnited Arab EmiratesUnited KingdomUnited StatesUruguayUzbekistanVanuatuVenezuela, RBVietnamYemen, Rep.ZambiaZimbabwe Timeline:
This timeline shows a graph from 1991 to 2010 of Liechtenstein. No data until 1990. Number of actual observations by date: 20.
Source name:
World Development Indicators
Source organization:
United Nations Framework Convention on Climate Change.
Categories, topics:
Climate Change, Environment
Last updated:
apr 23, 2017
Indicators value changes by year
Minimum:
-0.008
jan 1, 1997
Maximum:
-0.003
jan 1, 2000
At the date of observation
Value
Absolute change
Change from previous value
jan 1, 1991
-0.008
-0.008
0.0%
jan 1, 1992
-0.008
0.0
0.43%
jan 1, 1993
-0.008
0.0
0.43%
jan 1, 1994
-0.008
0.0
0.43%
jan 1, 1995
-0.008
0.0
0.42%
jan 1, 1996
-0.008
0.0
0.03%
jan 1, 1997
-0.008
0.0
0.41%
jan 1, 1998
-0.003
+0.005
-59.79%
jan 1, 1999
-0.003
+0.0
-0.28%
jan 1, 2000
-0.003
+0.0
-3.74%
jan 1, 2001
-0.003
0.0
0.2%
jan 1, 2002
-0.003
0.0
5.48%
jan 1, 2003
-0.003
+0.0
-1.58%
jan 1, 2004
-0.006
-0.003
78.02%
jan 1, 2005
-0.006
0.0
0.45%
jan 1, 2006
-0.006
0.0
0.35%
jan 1, 2007
-0.006
0.0
0.47%
jan 1, 2008
-0.006
0.0
0.34%
jan 1, 2009
-0.006
0.0
0.37%
jan 1, 2010
-0.006
0.0
0.39%
Ranking of countries by current statistics by years


Comments: