29
/
en
AIzaSyAYiBZKx7MnpbEhh9jyipgxe19OcubqV5w
April 1, 2024
81762
Belgium
BEL
true
2
1
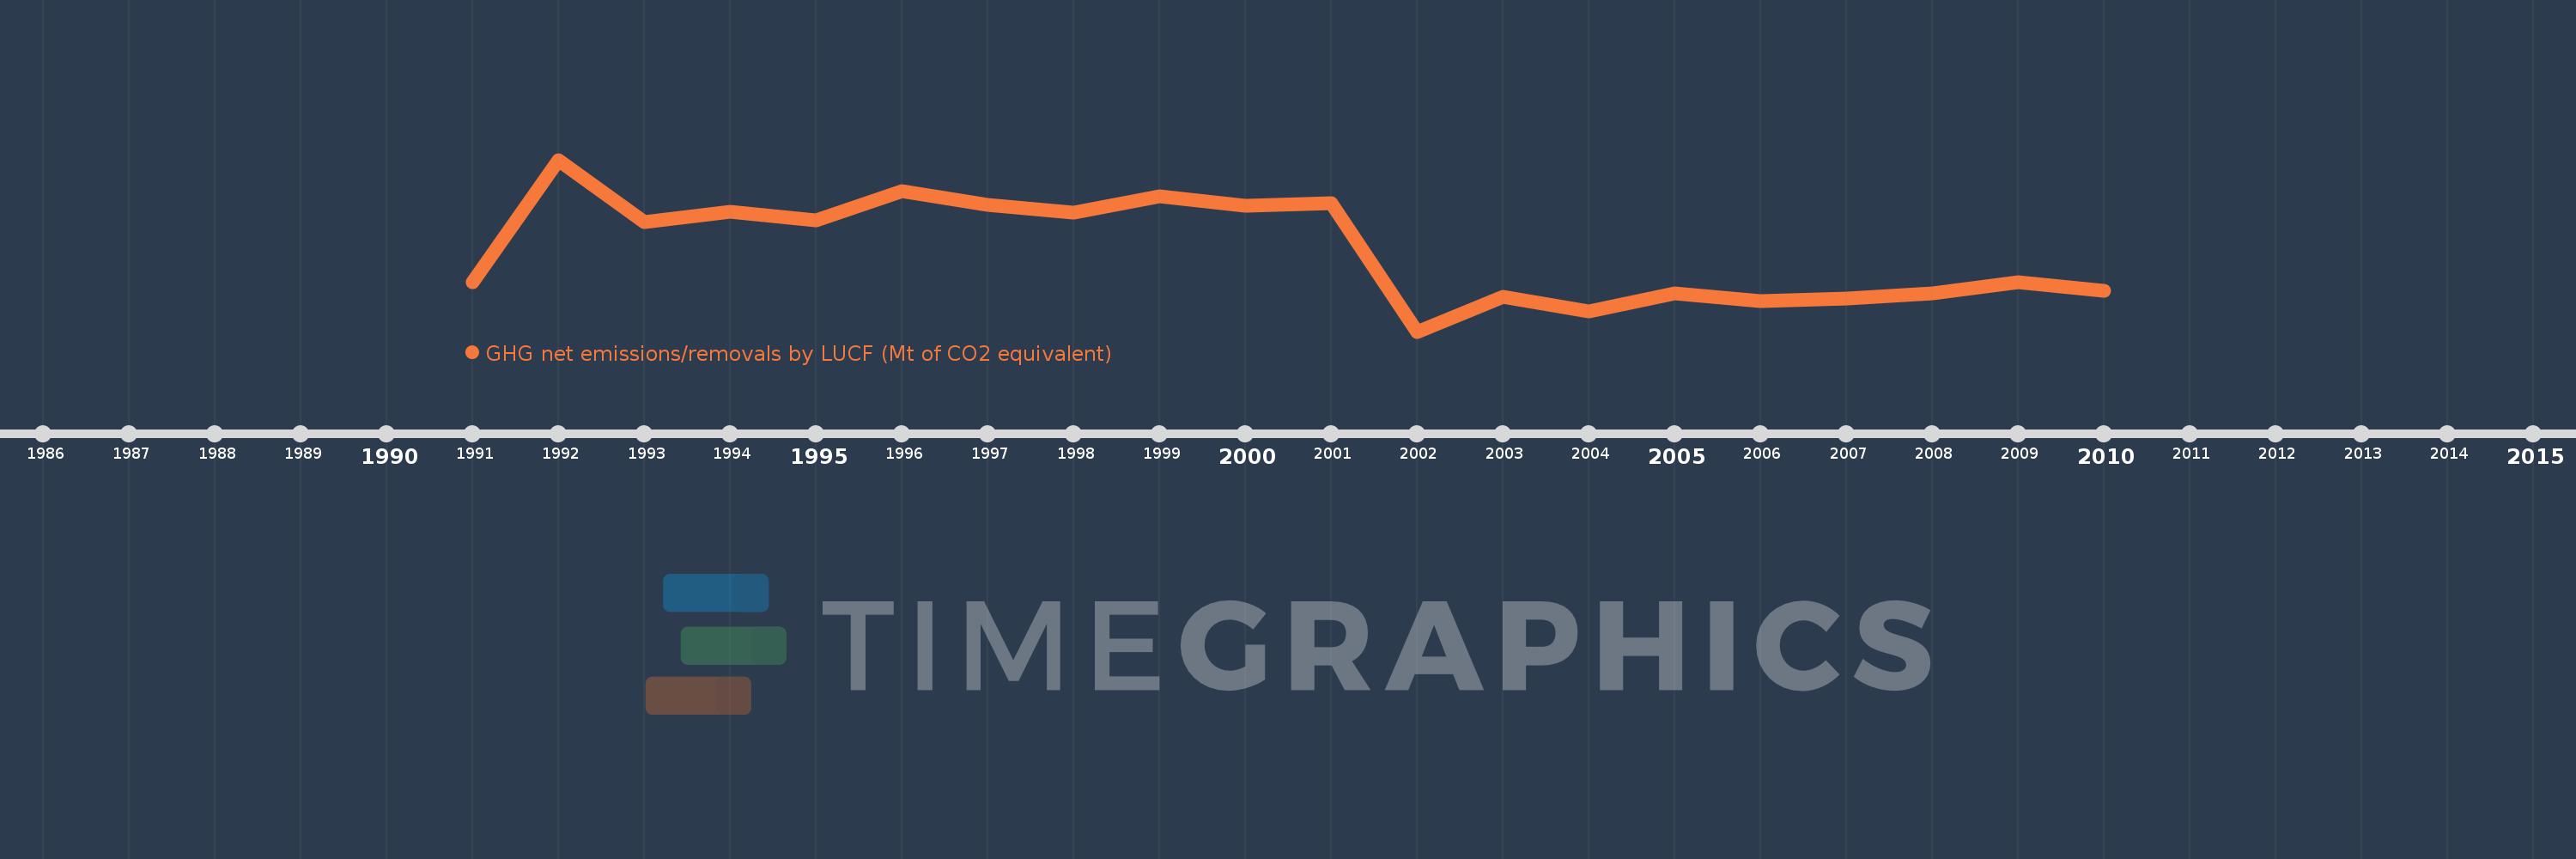
GHG net emissions/removals by LUCF (Mt of CO2 equivalent)
2010,2009,2008,2007,2006,2005,2004,2003,2002,2001,2000,1999,1998,1997,1996,1995,1994,1993,1992,1991
This statistics in other country:
AlbaniaAlgeriaAntigua and BarbudaArgentinaAustraliaAustriaAzerbaijanBangladeshBarbadosBelarusBelgiumBelizeBeninBhutanBoliviaBosnia and HerzegovinaBotswanaBrazilBulgariaBurkina FasoBurundiCabo VerdeCambodiaCameroonCanadaCentral African RepublicChadChileChinaColombiaComorosCongo, Dem. Rep.Congo, Rep.Costa RicaCote d'IvoireCroatiaCubaCzech RepublicDenmarkDjiboutiDominicaDominican RepublicEcuadorEgypt, Arab Rep.El SalvadorEritreaEstoniaEthiopiaFijiFinlandFranceGabonGambia, TheGeorgiaGermanyGhanaGreeceGrenadaGuatemalaGuineaGuyanaHaitiHondurasHungaryIcelandIndiaIndonesiaIran, Islamic Rep.IrelandIsraelItalyJamaicaJapanJordanKenyaKorea, Dem. People’s Rep.Korea, Rep.Kyrgyz RepublicLao PDRLatviaLebanonLesothoLiechtensteinLithuaniaLuxembourgMacedonia, FYRMadagascarMalawiMalaysiaMaliMaltaMauritaniaMauritiusMexicoMoldovaMonacoMongoliaMontenegroMoroccoMozambiqueNamibiaNauruNepalNetherlandsNew ZealandNicaraguaNigerNigeriaNorwayPakistanPanamaPapua New GuineaParaguayPeruPhilippinesPolandPortugalRomaniaRussian FederationRwandaSamoaSan MarinoSao Tome and PrincipeSaudi ArabiaSenegalSerbiaSeychellesSlovak RepublicSloveniaSouth AfricaSpainSri LankaSt. Kitts and NevisSt. LuciaSt. Vincent and the GrenadinesSudanSurinameSwazilandSwedenSwitzerlandTajikistanTanzaniaThailandTogoTongaTrinidad and TobagoTunisiaTurkeyTurkmenistanUgandaUkraineUnited Arab EmiratesUnited KingdomUnited StatesUruguayUzbekistanVanuatuVenezuela, RBVietnamYemen, Rep.ZambiaZimbabwe Timeline:
This timeline shows a graph from 1991 to 2010 of Belgium. No data until 1990. Number of actual observations by date: 20.
Source name:
World Development Indicators
Source organization:
United Nations Framework Convention on Climate Change.
Categories, topics:
Climate Change, Environment
Last updated:
apr 23, 2017
Indicators value changes by year
Minimum:
-1.804
jan 1, 2002
At the date of observation
Value
Absolute change
Change from previous value
jan 1, 1991
-1.557
-1.557
0.0%
jan 1, 1992
-0.94
+0.616
-39.59%
jan 1, 1993
-1.254
-0.314
33.35%
jan 1, 1994
-1.202
+0.052
-4.13%
jan 1, 1995
-1.245
-0.043
3.55%
jan 1, 1996
-1.099
+0.146
-11.71%
jan 1, 1997
-1.166
-0.067
6.1%
jan 1, 1998
-1.205
-0.039
3.32%
jan 1, 1999
-1.122
+0.083
-6.88%
jan 1, 2000
-1.173
-0.051
4.51%
jan 1, 2001
-1.159
+0.013
-1.13%
jan 1, 2002
-1.804
-0.644
55.55%
jan 1, 2003
-1.628
+0.176
-9.74%
jan 1, 2004
-1.703
-0.075
4.63%
jan 1, 2005
-1.612
+0.092
-5.39%
jan 1, 2006
-1.65
-0.038
2.37%
jan 1, 2007
-1.637
+0.013
-0.76%
jan 1, 2008
-1.612
+0.025
-1.55%
jan 1, 2009
-1.556
+0.056
-3.46%
jan 1, 2010
-1.6
-0.044
2.84%
Ranking of countries by current statistics by years


Comments: