29
/
en
AIzaSyAYiBZKx7MnpbEhh9jyipgxe19OcubqV5w
April 1, 2024
93581
Bulgaria
BGR
true
2
1
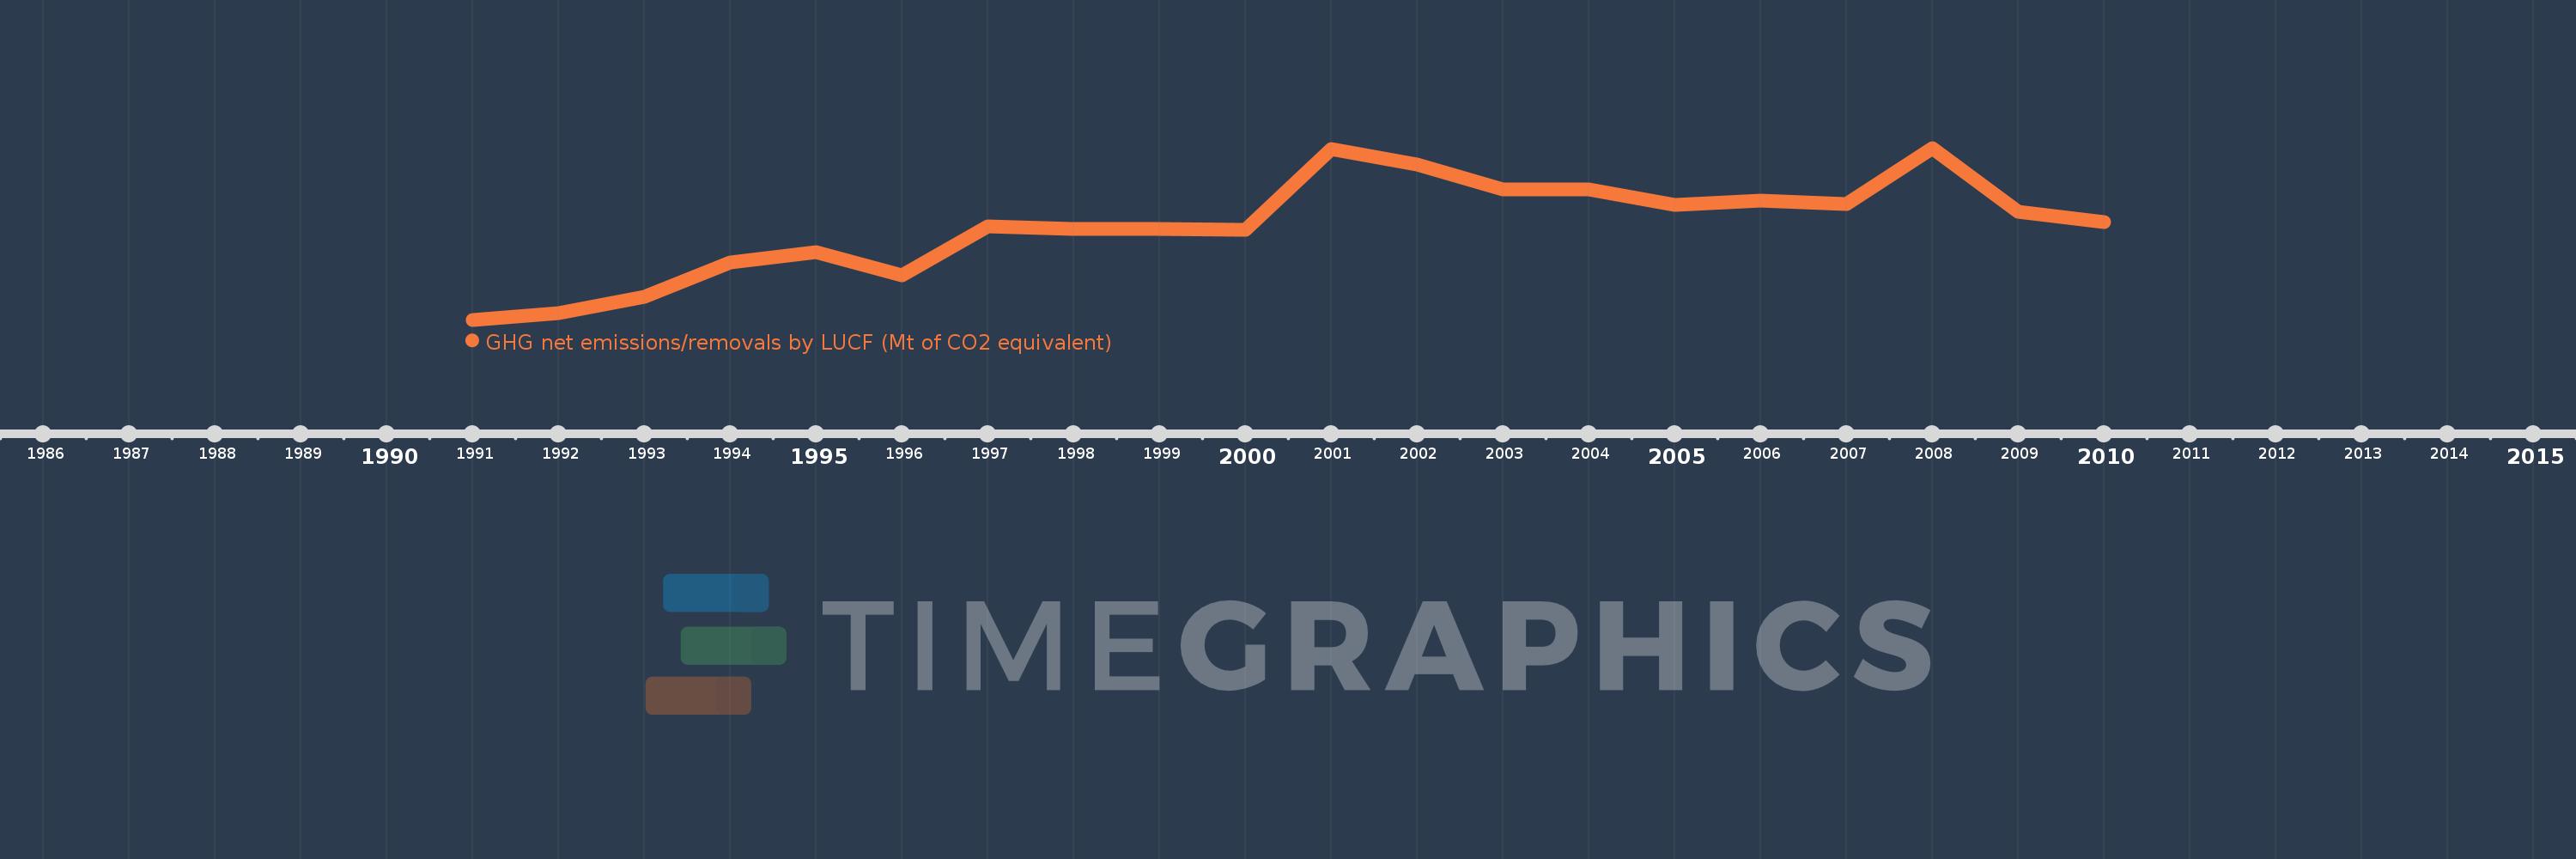
GHG net emissions/removals by LUCF (Mt of CO2 equivalent)
2010,2009,2008,2007,2006,2005,2004,2003,2002,2001,2000,1999,1998,1997,1996,1995,1994,1993,1992,1991
This statistics in other country:
AlbaniaAlgeriaAntigua and BarbudaArgentinaAustraliaAustriaAzerbaijanBangladeshBarbadosBelarusBelgiumBelizeBeninBhutanBoliviaBosnia and HerzegovinaBotswanaBrazilBulgariaBurkina FasoBurundiCabo VerdeCambodiaCameroonCanadaCentral African RepublicChadChileChinaColombiaComorosCongo, Dem. Rep.Congo, Rep.Costa RicaCote d'IvoireCroatiaCubaCzech RepublicDenmarkDjiboutiDominicaDominican RepublicEcuadorEgypt, Arab Rep.El SalvadorEritreaEstoniaEthiopiaFijiFinlandFranceGabonGambia, TheGeorgiaGermanyGhanaGreeceGrenadaGuatemalaGuineaGuyanaHaitiHondurasHungaryIcelandIndiaIndonesiaIran, Islamic Rep.IrelandIsraelItalyJamaicaJapanJordanKenyaKorea, Dem. People’s Rep.Korea, Rep.Kyrgyz RepublicLao PDRLatviaLebanonLesothoLiechtensteinLithuaniaLuxembourgMacedonia, FYRMadagascarMalawiMalaysiaMaliMaltaMauritaniaMauritiusMexicoMoldovaMonacoMongoliaMontenegroMoroccoMozambiqueNamibiaNauruNepalNetherlandsNew ZealandNicaraguaNigerNigeriaNorwayPakistanPanamaPapua New GuineaParaguayPeruPhilippinesPolandPortugalRomaniaRussian FederationRwandaSamoaSan MarinoSao Tome and PrincipeSaudi ArabiaSenegalSerbiaSeychellesSlovak RepublicSloveniaSouth AfricaSpainSri LankaSt. Kitts and NevisSt. LuciaSt. Vincent and the GrenadinesSudanSurinameSwazilandSwedenSwitzerlandTajikistanTanzaniaThailandTogoTongaTrinidad and TobagoTunisiaTurkeyTurkmenistanUgandaUkraineUnited Arab EmiratesUnited KingdomUnited StatesUruguayUzbekistanVanuatuVenezuela, RBVietnamYemen, Rep.ZambiaZimbabwe Timeline:
This timeline shows a graph from 1991 to 2010 of Bulgaria. No data until 1990. Number of actual observations by date: 20.
Source name:
World Development Indicators
Source organization:
United Nations Framework Convention on Climate Change.
Categories, topics:
Climate Change, Environment
Last updated:
apr 23, 2017
Indicators value changes by year
Minimum:
-13.806
jan 1, 1991
Maximum:
-10.255
jan 1, 2008
At the date of observation
Value
Absolute change
Change from previous value
jan 1, 1991
-13.806
-13.806
0.0%
jan 1, 1992
-13.672
+0.134
-0.97%
jan 1, 1993
-13.339
+0.333
-2.44%
jan 1, 1994
-12.621
+0.717
-5.38%
jan 1, 1995
-12.4
+0.221
-1.75%
jan 1, 1996
-12.886
-0.485
3.91%
jan 1, 1997
-11.871
+1.015
-7.87%
jan 1, 1998
-11.937
-0.066
0.55%
jan 1, 1999
-11.931
+0.005
-0.05%
jan 1, 2000
-11.944
-0.013
0.11%
jan 1, 2001
-10.276
+1.668
-13.96%
jan 1, 2002
-10.605
-0.329
3.2%
jan 1, 2003
-11.109
-0.504
4.75%
jan 1, 2004
-11.121
-0.012
0.11%
jan 1, 2005
-11.441
-0.32
2.88%
jan 1, 2006
-11.336
+0.105
-0.92%
jan 1, 2007
-11.406
-0.069
0.61%
jan 1, 2008
-10.255
+1.151
-10.09%
jan 1, 2009
-11.566
-1.311
12.79%
jan 1, 2010
-11.782
-0.216
1.87%
Ranking of countries by current statistics by years


Comments: