29
/
en
AIzaSyAYiBZKx7MnpbEhh9jyipgxe19OcubqV5w
April 1, 2024
228497
Romania
ROU
true
2
1
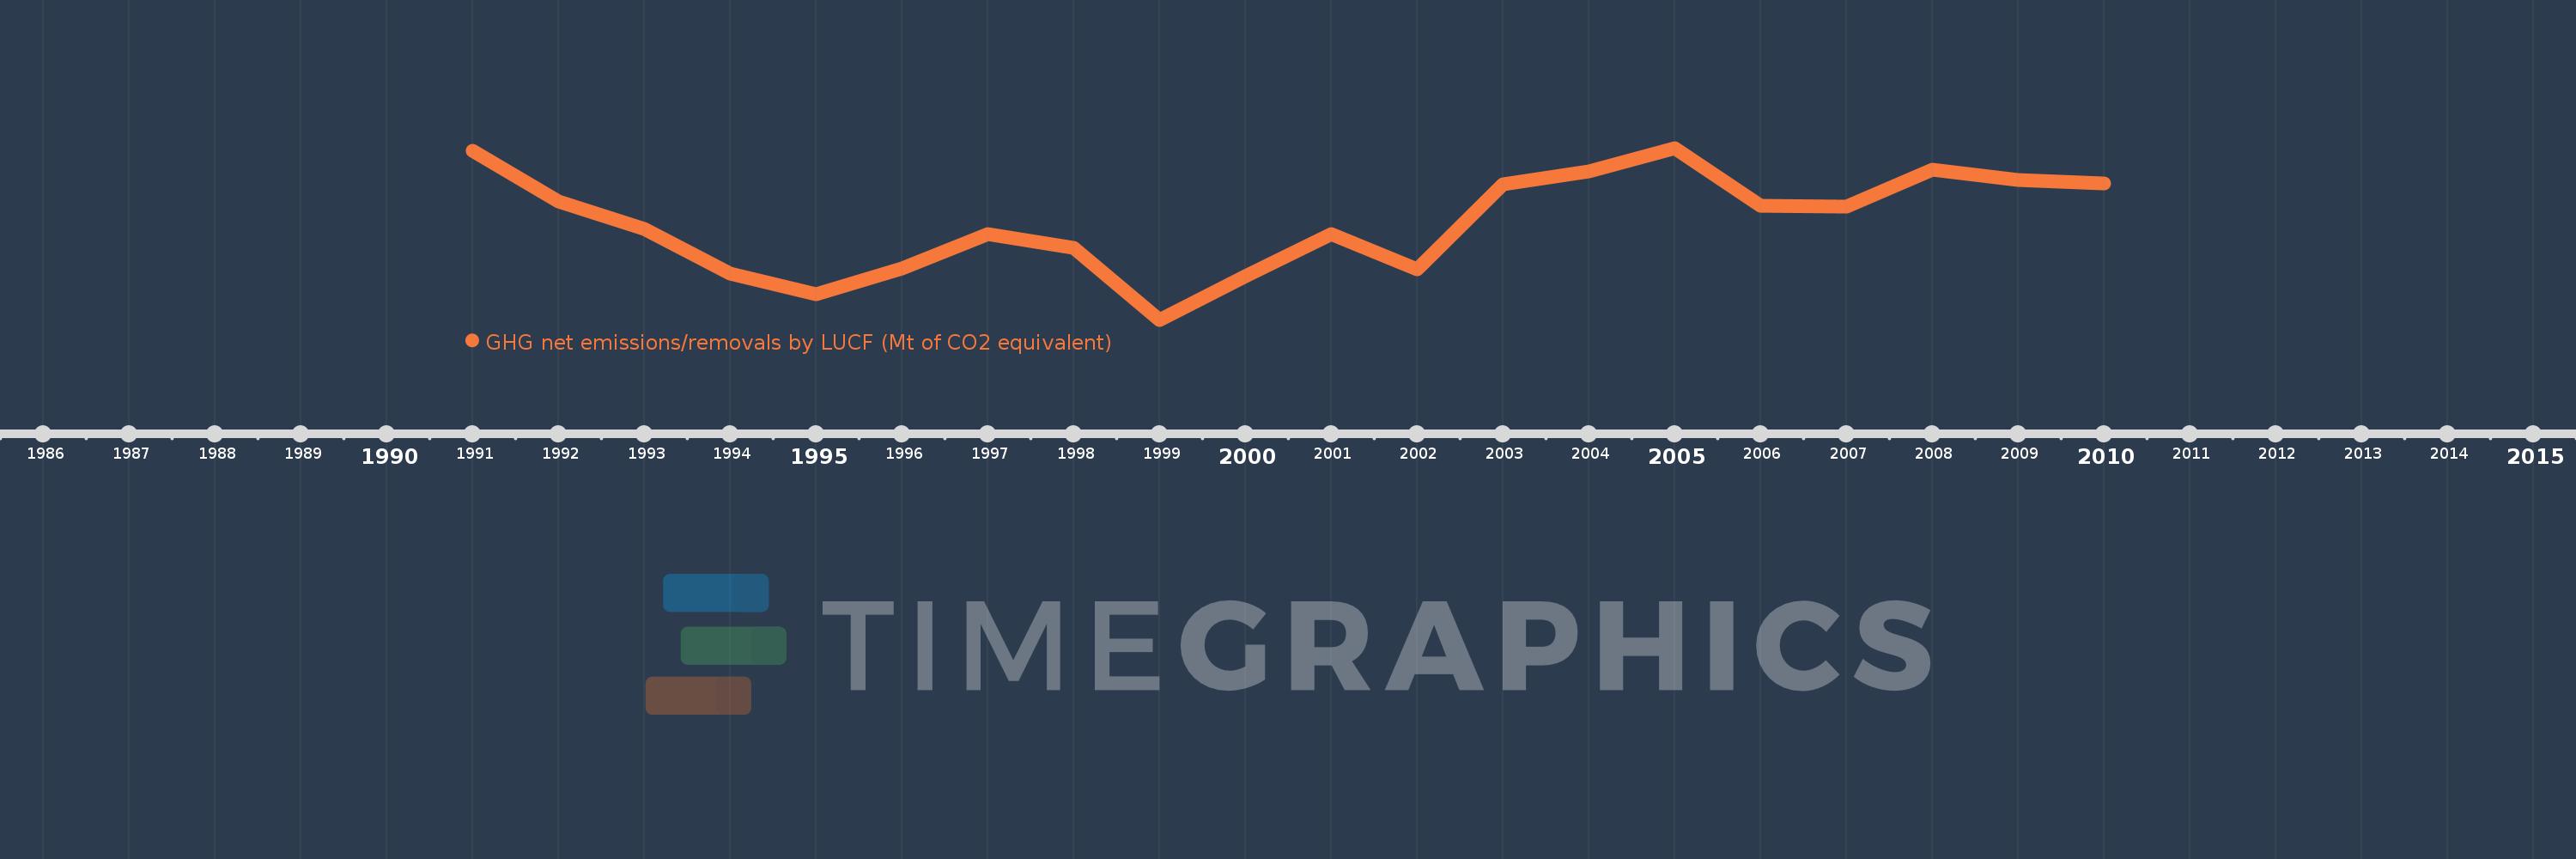
GHG net emissions/removals by LUCF (Mt of CO2 equivalent)
2010,2009,2008,2007,2006,2005,2004,2003,2002,2001,2000,1999,1998,1997,1996,1995,1994,1993,1992,1991
This statistics in other country:
AlbaniaAlgeriaAntigua and BarbudaArgentinaAustraliaAustriaAzerbaijanBangladeshBarbadosBelarusBelgiumBelizeBeninBhutanBoliviaBosnia and HerzegovinaBotswanaBrazilBulgariaBurkina FasoBurundiCabo VerdeCambodiaCameroonCanadaCentral African RepublicChadChileChinaColombiaComorosCongo, Dem. Rep.Congo, Rep.Costa RicaCote d'IvoireCroatiaCubaCzech RepublicDenmarkDjiboutiDominicaDominican RepublicEcuadorEgypt, Arab Rep.El SalvadorEritreaEstoniaEthiopiaFijiFinlandFranceGabonGambia, TheGeorgiaGermanyGhanaGreeceGrenadaGuatemalaGuineaGuyanaHaitiHondurasHungaryIcelandIndiaIndonesiaIran, Islamic Rep.IrelandIsraelItalyJamaicaJapanJordanKenyaKorea, Dem. People’s Rep.Korea, Rep.Kyrgyz RepublicLao PDRLatviaLebanonLesothoLiechtensteinLithuaniaLuxembourgMacedonia, FYRMadagascarMalawiMalaysiaMaliMaltaMauritaniaMauritiusMexicoMoldovaMonacoMongoliaMontenegroMoroccoMozambiqueNamibiaNauruNepalNetherlandsNew ZealandNicaraguaNigerNigeriaNorwayPakistanPanamaPapua New GuineaParaguayPeruPhilippinesPolandPortugalRomaniaRussian FederationRwandaSamoaSan MarinoSao Tome and PrincipeSaudi ArabiaSenegalSerbiaSeychellesSlovak RepublicSloveniaSouth AfricaSpainSri LankaSt. Kitts and NevisSt. LuciaSt. Vincent and the GrenadinesSudanSurinameSwazilandSwedenSwitzerlandTajikistanTanzaniaThailandTogoTongaTrinidad and TobagoTunisiaTurkeyTurkmenistanUgandaUkraineUnited Arab EmiratesUnited KingdomUnited StatesUruguayUzbekistanVanuatuVenezuela, RBVietnamYemen, Rep.ZambiaZimbabwe Timeline:
This timeline shows a graph from 1991 to 2010 of Romania. No data until 1990. Number of actual observations by date: 20.
Source name:
World Development Indicators
Source organization:
United Nations Framework Convention on Climate Change.
Categories, topics:
Climate Change, Environment
Last updated:
apr 23, 2017
Indicators value changes by year
Minimum:
-40.481
jan 1, 1999
Maximum:
-35.492
jan 1, 2005
At the date of observation
Value
Absolute change
Change from previous value
jan 1, 1991
-35.583
-35.583
0.0%
jan 1, 1992
-37.041
-1.458
4.1%
jan 1, 1993
-37.846
-0.804
2.17%
jan 1, 1994
-39.131
-1.285
3.4%
jan 1, 1995
-39.734
-0.603
1.54%
jan 1, 1996
-38.987
+0.747
-1.88%
jan 1, 1997
-38.003
+0.985
-2.53%
jan 1, 1998
-38.39
-0.387
1.02%
jan 1, 1999
-40.481
-2.091
5.45%
jan 1, 2000
-39.208
+1.273
-3.14%
jan 1, 2001
-37.999
+1.209
-3.08%
jan 1, 2002
-39.007
-1.008
2.65%
jan 1, 2003
-36.536
+2.471
-6.34%
jan 1, 2004
-36.174
+0.362
-0.99%
jan 1, 2005
-35.492
+0.682
-1.88%
jan 1, 2006
-37.181
-1.689
4.76%
jan 1, 2007
-37.2
-0.019
0.05%
jan 1, 2008
-36.114
+1.085
-2.92%
jan 1, 2009
-36.415
-0.3
0.83%
jan 1, 2010
-36.533
-0.119
0.33%
Ranking of countries by current statistics by years


Comments: