29
/
en
AIzaSyAYiBZKx7MnpbEhh9jyipgxe19OcubqV5w
April 1, 2024
257059
Switzerland
CHE
true
2
1
Arable land (hectares)
2015,2014,2013,2012,2011,2010,2009,2008,2007,2006,2005,2004,2003,2002,2001,2000,1999,1998,1997,1996,1995,1994,1993,1992,1991,1990,1989,1988,1987,1986,1985,1984,1983,1982,1981,1980,1979,1978,1977,1976,1975,1974,1973,1972,1971,1970,1969,1968,1967,1966,1965,1964,1963,1962
This statistics in other country:
AfghanistanAlbaniaAlgeriaAmerican SamoaAndorraAngolaAntigua and BarbudaArgentinaArmeniaArubaAustraliaAustriaAzerbaijanBahamas, TheBahrainBangladeshBarbadosBelarusBelgiumBelizeBeninBermudaBhutanBoliviaBosnia and HerzegovinaBotswanaBrazilBritish Virgin IslandsBrunei DarussalamBulgariaBurkina FasoBurundiCabo VerdeCambodiaCameroonCanadaCayman IslandsCentral African RepublicChadChannel IslandsChileChinaColombiaComorosCongo, Dem. Rep.Congo, Rep.Costa RicaCote d'IvoireCroatiaCubaCyprusCzech RepublicDenmarkDjiboutiDominicaDominican RepublicEcuadorEgypt, Arab Rep.El SalvadorEquatorial GuineaEritreaEstoniaEthiopiaFaroe IslandsFijiFinlandFranceFrench PolynesiaGabonGambia, TheGeorgiaGermanyGhanaGreeceGreenlandGrenadaGuamGuatemalaGuineaGuinea-BissauGuyanaHaitiHondurasHong Kong SAR, ChinaHungaryIcelandIndiaIndonesiaIran, Islamic Rep.IraqIrelandIsle of ManIsraelItalyJamaicaJapanJordanKazakhstanKenyaKiribatiKorea, Dem. People’s Rep.Korea, Rep.KosovoKuwaitKyrgyz RepublicLao PDRLatviaLebanonLesothoLiberiaLibyaLiechtensteinLithuaniaLuxembourgMacedonia, FYRMadagascarMalawiMalaysiaMaldivesMaliMaltaMarshall IslandsMauritaniaMauritiusMexicoMicronesia, Fed. Sts.MoldovaMongoliaMontenegroMoroccoMozambiqueMyanmarNamibiaNepalNetherlandsNew CaledoniaNew ZealandNicaraguaNigerNigeriaNorthern Mariana IslandsNorwayOmanPakistanPalauPanamaPapua New GuineaParaguayPeruPhilippinesPolandPortugalPuerto RicoQatarRomaniaRussian FederationRwandaSamoaSan MarinoSao Tome and PrincipeSaudi ArabiaSenegalSerbiaSeychellesSierra LeoneSingaporeSlovak RepublicSloveniaSolomon IslandsSomaliaSouth AfricaSpainSri LankaSt. Kitts and NevisSt. LuciaSt. Vincent and the GrenadinesSudanSurinameSwazilandSwedenSwitzerlandSyrian Arab RepublicTajikistanTanzaniaThailandTimor-LesteTogoTongaTrinidad and TobagoTunisiaTurkeyTurkmenistanTurks and Caicos IslandsUgandaUkraineUnited Arab EmiratesUnited KingdomUnited StatesUruguayUzbekistanVanuatuVenezuela, RBVietnamVirgin Islands (U.S.)West Bank and GazaYemen, Rep.ZambiaZimbabwe Timeline:
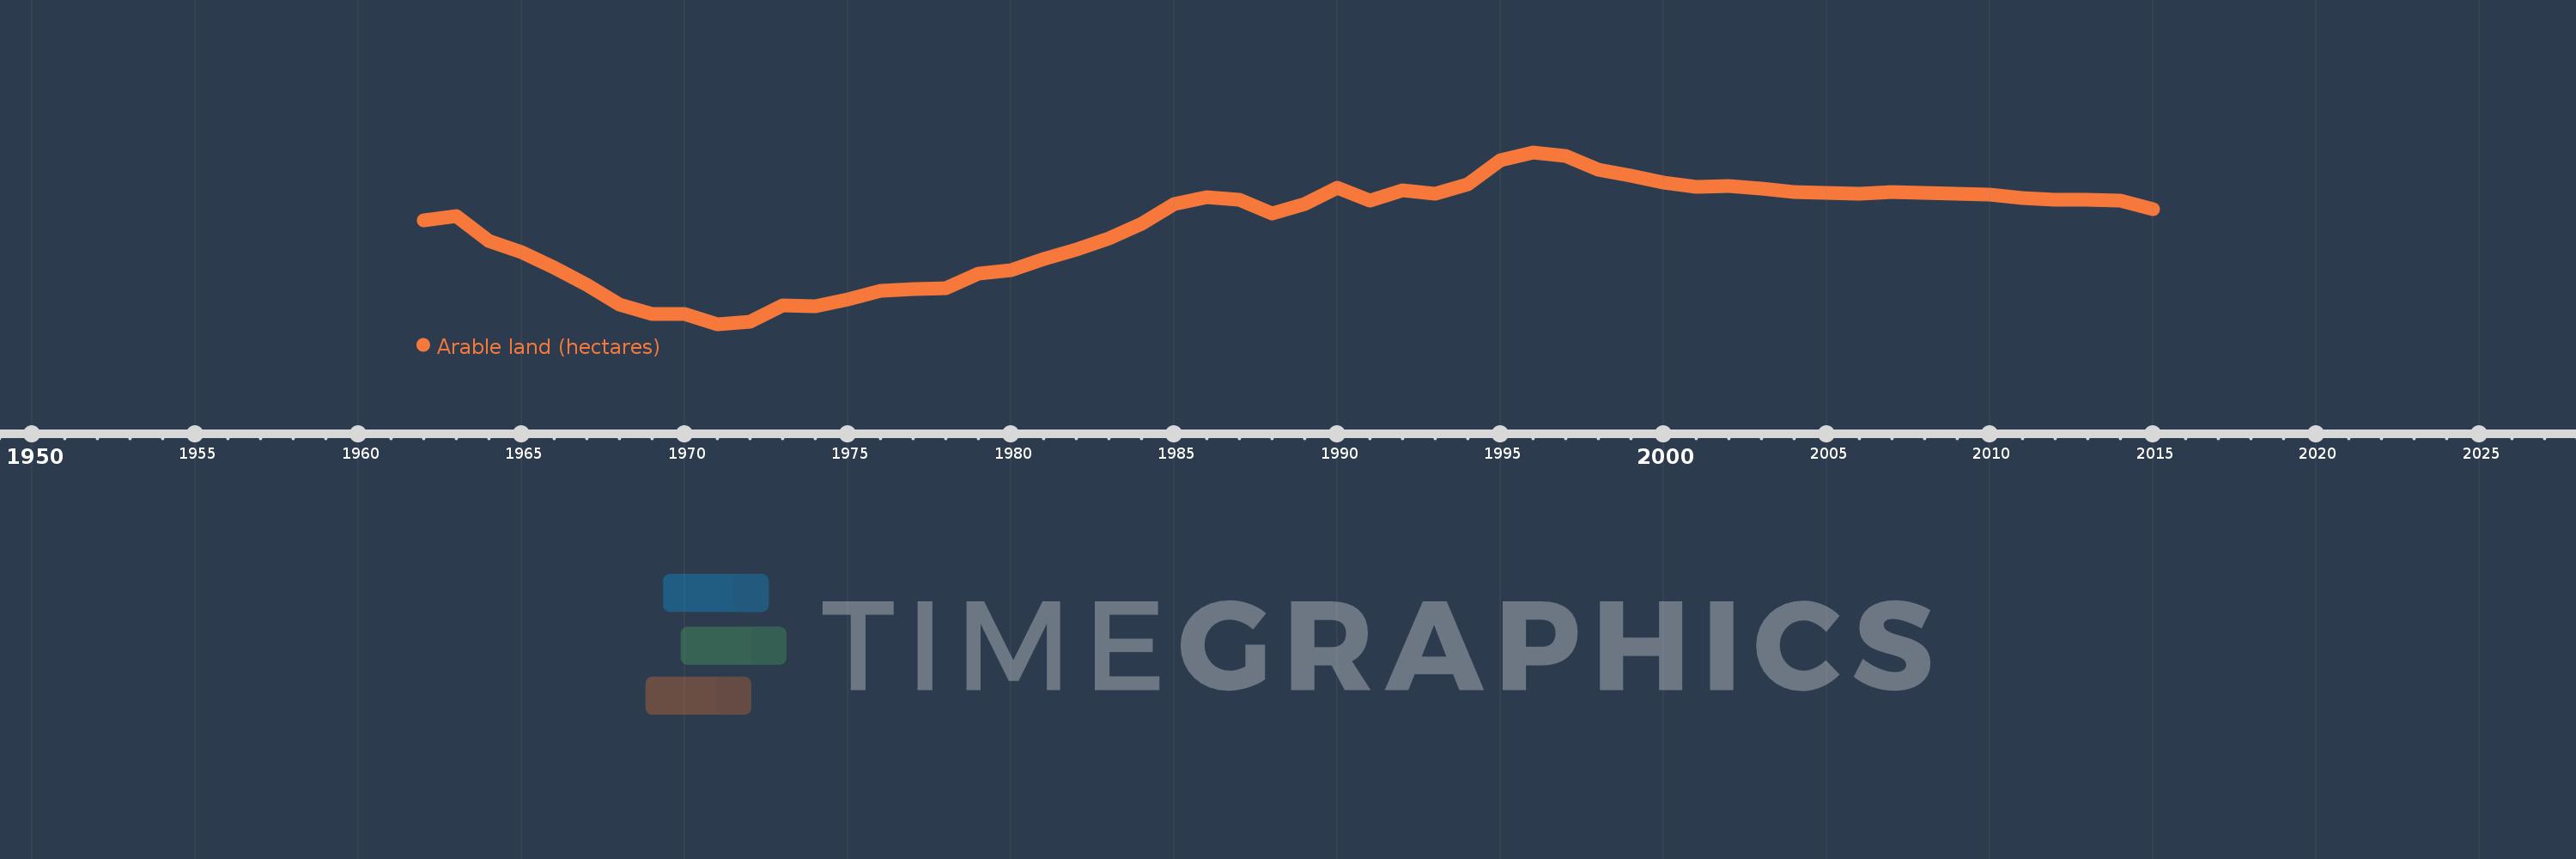
This timeline shows a graph from 1962 to 2015 of Switzerland. No data until 1961. Number of actual observations by date: 54.
Source name:
World Development Indicators
Source organization:
Food and Agriculture Organization, electronic files and web site.
Categories, topics:
Agriculture & Rural Development
Last updated:
apr 23, 2017
Indicators value changes by year
Minimum:
355.9K
jan 1, 1971
Maximum:
422.2K
jan 1, 1996
At the date of observation
Value
Absolute change
Change from previous value
jan 1, 1962
396.1K
+396.1K
0.0%
jan 1, 1963
397.7K
+1.6K
0.4%
jan 1, 1964
387.9K
-9.8K
-2.46%
jan 1, 1965
383.8K
-4.1K
-1.06%
jan 1, 1966
377.7K
-6.1K
-1.59%
jan 1, 1967
371.0K
-6.7K
-1.77%
jan 1, 1968
363.4K
-7.6K
-2.05%
jan 1, 1969
359.7K
-3.7K
-1.02%
jan 1, 1970
360.0K
+300.0
0.08%
jan 1, 1971
355.9K
-4.1K
-1.14%
jan 1, 1972
356.9K
+1000.0
0.28%
jan 1, 1973
363.0K
+6.1K
1.71%
jan 1, 1974
362.8K
-200.0
-0.06%
jan 1, 1975
365.4K
+2.6K
0.72%
jan 1, 1976
368.9K
+3.5K
0.96%
jan 1, 1977
369.5K
+600.0
0.16%
jan 1, 1978
369.9K
+400.0
0.11%
jan 1, 1979
375.3K
+5.4K
1.46%
jan 1, 1980
376.9K
+1.6K
0.43%
jan 1, 1981
381.1K
+4.2K
1.11%
jan 1, 1982
384.6K
+3.5K
0.92%
jan 1, 1983
388.9K
+4.3K
1.12%
jan 1, 1984
394.5K
+5.6K
1.44%
jan 1, 1985
402.4K
+7.9K
2.0%
jan 1, 1986
405.0K
+2.6K
0.65%
jan 1, 1987
404.1K
-900.0
-0.22%
jan 1, 1988
398.7K
-5.4K
-1.34%
jan 1, 1989
402.2K
+3.5K
0.88%
jan 1, 1990
408.6K
+6.4K
1.59%
jan 1, 1991
403.7K
-4.9K
-1.2%
jan 1, 1992
407.5K
+3.8K
0.94%
jan 1, 1993
406.1K
-1.4K
-0.34%
jan 1, 1994
409.9K
+3.8K
0.94%
jan 1, 1995
419.2K
+9.3K
2.27%
jan 1, 1996
422.2K
+3.0K
0.72%
jan 1, 1997
420.9K
-1.3K
-0.31%
jan 1, 1998
415.5K
-5.4K
-1.28%
jan 1, 1999
413.3K
-2.2K
-0.53%
jan 1, 2000
410.6K
-2.7K
-0.65%
jan 1, 2001
408.8K
-1.8K
-0.44%
jan 1, 2002
409.4K
+600.0
0.15%
jan 1, 2003
408.3K
-1.1K
-0.27%
jan 1, 2004
406.9K
-1.4K
-0.34%
jan 1, 2005
406.5K
-400.0
-0.1%
jan 1, 2006
406.2K
-300.0
-0.07%
jan 1, 2007
407.0K
+800.0
0.2%
jan 1, 2008
406.6K
-400.0
-0.1%
jan 1, 2009
406.3K
-300.0
-0.07%
jan 1, 2010
406.0K
-300.0
-0.07%
jan 1, 2011
404.5K
-1.5K
-0.37%
jan 1, 2012
403.9K
-600.0
-0.15%
jan 1, 2013
403.8K
-100.0
-0.02%
jan 1, 2014
403.7K
-100.0
-0.02%
jan 1, 2015
400.2K
-3.5K
-0.87%
Ranking of countries by current statistics by years


Comments: