29
/
en
AIzaSyAYiBZKx7MnpbEhh9jyipgxe19OcubqV5w
April 1, 2024
275439
United Kingdom
GBR
true
2
1
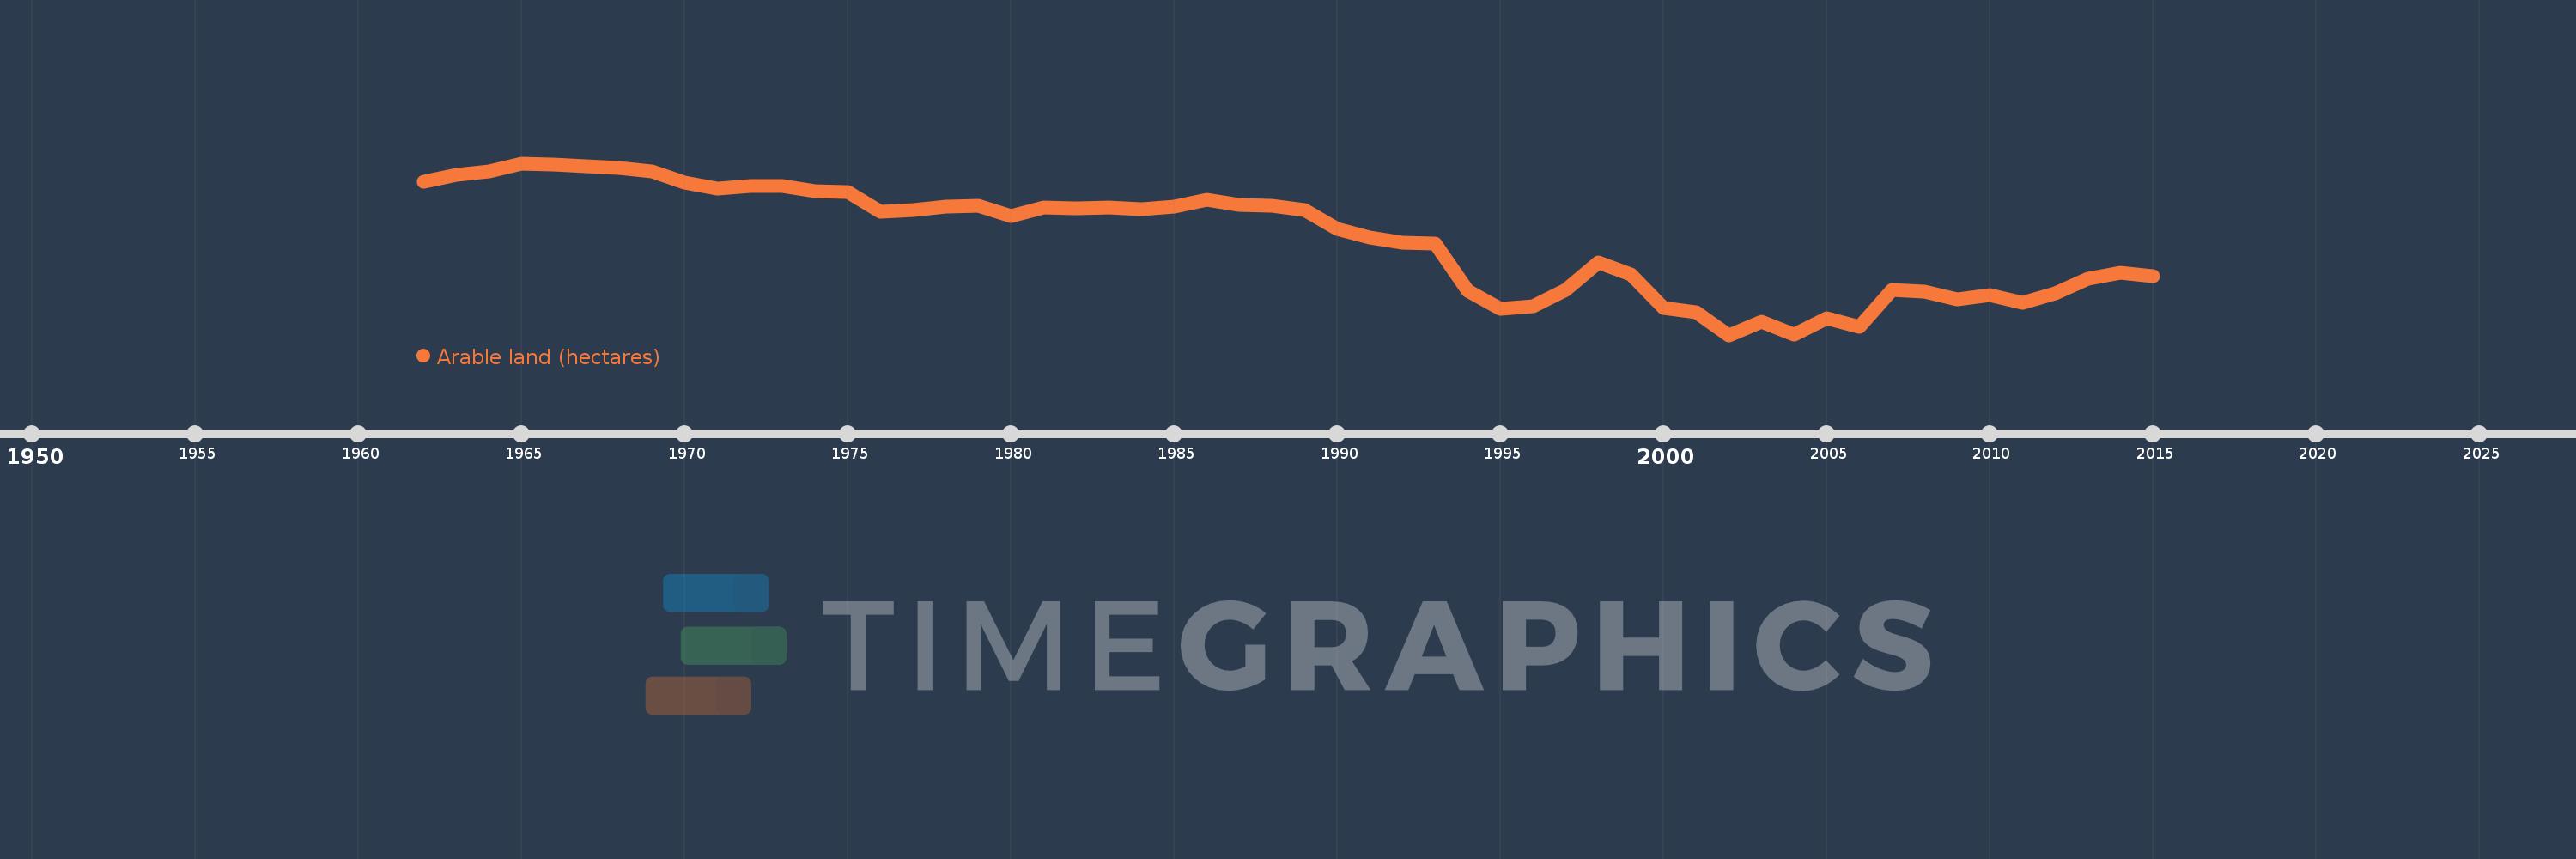
Arable land (hectares)
2015,2014,2013,2012,2011,2010,2009,2008,2007,2006,2005,2004,2003,2002,2001,2000,1999,1998,1997,1996,1995,1994,1993,1992,1991,1990,1989,1988,1987,1986,1985,1984,1983,1982,1981,1980,1979,1978,1977,1976,1975,1974,1973,1972,1971,1970,1969,1968,1967,1966,1965,1964,1963,1962
This statistics in other country:
AfghanistanAlbaniaAlgeriaAmerican SamoaAndorraAngolaAntigua and BarbudaArgentinaArmeniaArubaAustraliaAustriaAzerbaijanBahamas, TheBahrainBangladeshBarbadosBelarusBelgiumBelizeBeninBermudaBhutanBoliviaBosnia and HerzegovinaBotswanaBrazilBritish Virgin IslandsBrunei DarussalamBulgariaBurkina FasoBurundiCabo VerdeCambodiaCameroonCanadaCayman IslandsCentral African RepublicChadChannel IslandsChileChinaColombiaComorosCongo, Dem. Rep.Congo, Rep.Costa RicaCote d'IvoireCroatiaCubaCyprusCzech RepublicDenmarkDjiboutiDominicaDominican RepublicEcuadorEgypt, Arab Rep.El SalvadorEquatorial GuineaEritreaEstoniaEthiopiaFaroe IslandsFijiFinlandFranceFrench PolynesiaGabonGambia, TheGeorgiaGermanyGhanaGreeceGreenlandGrenadaGuamGuatemalaGuineaGuinea-BissauGuyanaHaitiHondurasHong Kong SAR, ChinaHungaryIcelandIndiaIndonesiaIran, Islamic Rep.IraqIrelandIsle of ManIsraelItalyJamaicaJapanJordanKazakhstanKenyaKiribatiKorea, Dem. People’s Rep.Korea, Rep.KosovoKuwaitKyrgyz RepublicLao PDRLatviaLebanonLesothoLiberiaLibyaLiechtensteinLithuaniaLuxembourgMacedonia, FYRMadagascarMalawiMalaysiaMaldivesMaliMaltaMarshall IslandsMauritaniaMauritiusMexicoMicronesia, Fed. Sts.MoldovaMongoliaMontenegroMoroccoMozambiqueMyanmarNamibiaNepalNetherlandsNew CaledoniaNew ZealandNicaraguaNigerNigeriaNorthern Mariana IslandsNorwayOmanPakistanPalauPanamaPapua New GuineaParaguayPeruPhilippinesPolandPortugalPuerto RicoQatarRomaniaRussian FederationRwandaSamoaSan MarinoSao Tome and PrincipeSaudi ArabiaSenegalSerbiaSeychellesSierra LeoneSingaporeSlovak RepublicSloveniaSolomon IslandsSomaliaSouth AfricaSpainSri LankaSt. Kitts and NevisSt. LuciaSt. Vincent and the GrenadinesSudanSurinameSwazilandSwedenSwitzerlandSyrian Arab RepublicTajikistanTanzaniaThailandTimor-LesteTogoTongaTrinidad and TobagoTunisiaTurkeyTurkmenistanTurks and Caicos IslandsUgandaUkraineUnited Arab EmiratesUnited KingdomUnited StatesUruguayUzbekistanVanuatuVenezuela, RBVietnamVirgin Islands (U.S.)West Bank and GazaYemen, Rep.ZambiaZimbabwe Timeline:
This timeline shows a graph from 1962 to 2015 of United Kingdom. No data until 1961. Number of actual observations by date: 54.
Source name:
World Development Indicators
Source organization:
Food and Agriculture Organization, electronic files and web site.
Categories, topics:
Agriculture & Rural Development
Last updated:
apr 23, 2017
Indicators value changes by year
Minimum:
5.651 mln
jan 1, 2002
Maximum:
7.354 mln
jan 1, 1965
At the date of observation
Value
Absolute change
Change from previous value
jan 1, 1962
7.175 mln
+7.175 mln
0.0%
jan 1, 1963
7.236 mln
+61.0K
0.85%
jan 1, 1964
7.275 mln
+39.0K
0.54%
jan 1, 1965
7.354 mln
+79.0K
1.09%
jan 1, 1966
7.339 mln
-15.0K
-0.2%
jan 1, 1967
7.324 mln
-15.0K
-0.2%
jan 1, 1968
7.309 mln
-15.0K
-0.2%
jan 1, 1969
7.277 mln
-32.0K
-0.44%
jan 1, 1970
7.163 mln
-114.0K
-1.57%
jan 1, 1971
7.102 mln
-61.0K
-0.85%
jan 1, 1972
7.132 mln
+30.0K
0.42%
jan 1, 1973
7.129 mln
-3.0K
-0.04%
jan 1, 1974
7.075 mln
-54.0K
-0.76%
jan 1, 1975
7.067 mln
-8.0K
-0.11%
jan 1, 1976
6.869 mln
-198.0K
-2.8%
jan 1, 1977
6.894 mln
+25.0K
0.36%
jan 1, 1978
6.921 mln
+27.0K
0.39%
jan 1, 1979
6.936 mln
+15.0K
0.22%
jan 1, 1980
6.829 mln
-107.0K
-1.54%
jan 1, 1981
6.918 mln
+89.0K
1.3%
jan 1, 1982
6.907 mln
-11.0K
-0.16%
jan 1, 1983
6.913 mln
+6.0K
0.09%
jan 1, 1984
6.899 mln
-14.0K
-0.2%
jan 1, 1985
6.922 mln
+23.0K
0.33%
jan 1, 1986
6.99 mln
+68.0K
0.98%
jan 1, 1987
6.94 mln
-50.0K
-0.72%
jan 1, 1988
6.935 mln
-5.0K
-0.07%
jan 1, 1989
6.886 mln
-49.0K
-0.71%
jan 1, 1990
6.702 mln
-184.0K
-2.67%
jan 1, 1991
6.62 mln
-82.0K
-1.22%
jan 1, 1992
6.567 mln
-53.0K
-0.8%
jan 1, 1993
6.554 mln
-13.0K
-0.2%
jan 1, 1994
6.091 mln
-463.0K
-7.06%
jan 1, 1995
5.911 mln
-180.0K
-2.96%
jan 1, 1996
5.936 mln
+25.0K
0.42%
jan 1, 1997
6.098 mln
+162.0K
2.73%
jan 1, 1998
6.368 mln
+270.0K
4.43%
jan 1, 1999
6.253 mln
-115.0K
-1.81%
jan 1, 2000
5.917 mln
-336.0K
-5.37%
jan 1, 2001
5.876 mln
-41.0K
-0.69%
jan 1, 2002
5.651 mln
-225.0K
-3.83%
jan 1, 2003
5.786 mln
+135.0K
2.39%
jan 1, 2004
5.659 mln
-127.0K
-2.19%
jan 1, 2005
5.819 mln
+160.0K
2.83%
jan 1, 2006
5.729 mln
-90.0K
-1.55%
jan 1, 2007
6.094 mln
+365.0K
6.37%
jan 1, 2008
6.085 mln
-9.0K
-0.15%
jan 1, 2009
6.005 mln
-80.0K
-1.31%
jan 1, 2010
6.049 mln
+44.0K
0.73%
jan 1, 2011
5.97 mln
-79.0K
-1.31%
jan 1, 2012
6.062 mln
+92.0K
1.54%
jan 1, 2013
6.212 mln
+150.0K
2.47%
jan 1, 2014
6.265 mln
+53.4K
0.86%
jan 1, 2015
6.234 mln
-31.9K
-0.51%
Ranking of countries by current statistics by years


Comments: