29
/
en
AIzaSyAYiBZKx7MnpbEhh9jyipgxe19OcubqV5w
April 1, 2024
142494
Greenland
GRL
true
2
1
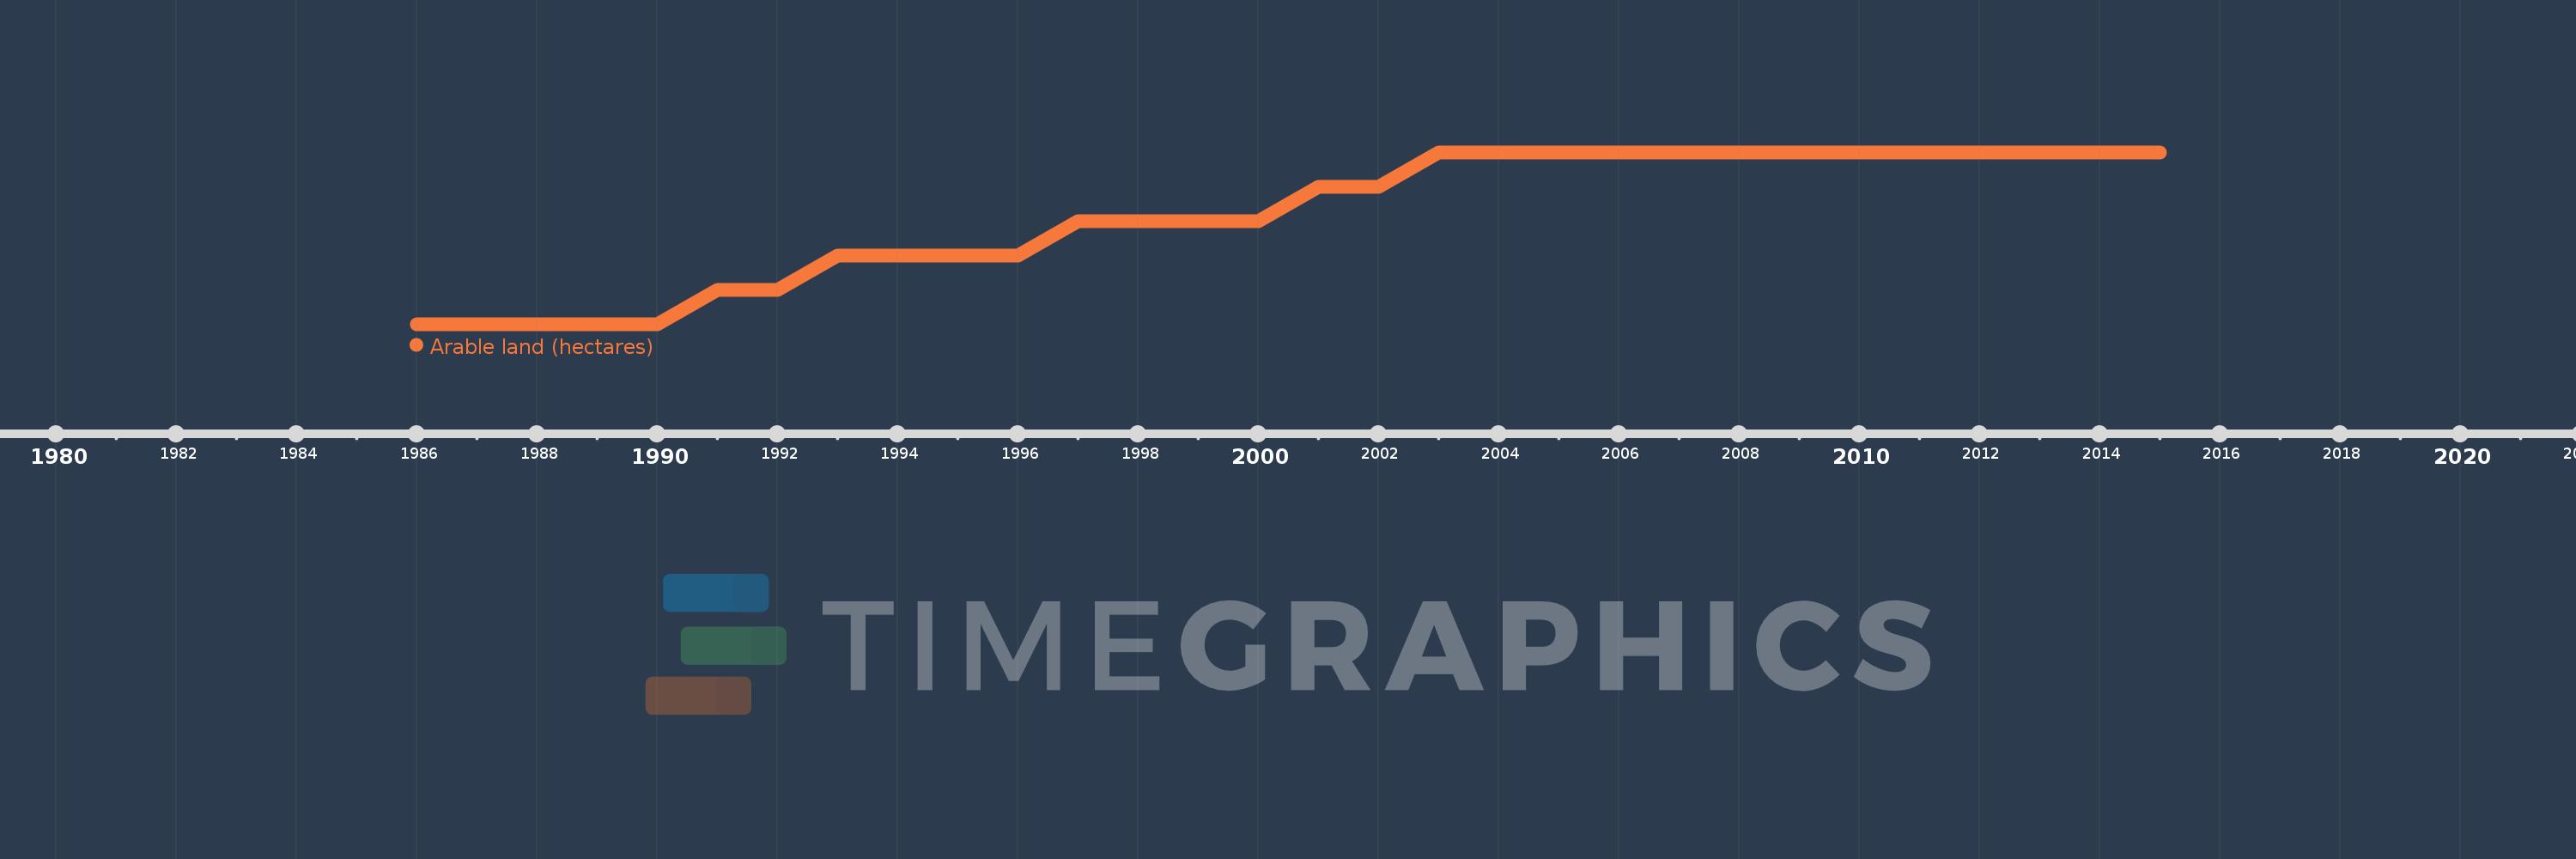
Arable land (hectares)
2015,2014,2013,2012,2011,2010,2009,2008,2007,2006,2005,2004,2003,2002,2001,2000,1999,1998,1997,1996,1995,1994,1993,1992,1991,1990,1989,1988,1987,1986
This statistics in other country:
AfghanistanAlbaniaAlgeriaAmerican SamoaAndorraAngolaAntigua and BarbudaArgentinaArmeniaArubaAustraliaAustriaAzerbaijanBahamas, TheBahrainBangladeshBarbadosBelarusBelgiumBelizeBeninBermudaBhutanBoliviaBosnia and HerzegovinaBotswanaBrazilBritish Virgin IslandsBrunei DarussalamBulgariaBurkina FasoBurundiCabo VerdeCambodiaCameroonCanadaCayman IslandsCentral African RepublicChadChannel IslandsChileChinaColombiaComorosCongo, Dem. Rep.Congo, Rep.Costa RicaCote d'IvoireCroatiaCubaCyprusCzech RepublicDenmarkDjiboutiDominicaDominican RepublicEcuadorEgypt, Arab Rep.El SalvadorEquatorial GuineaEritreaEstoniaEthiopiaFaroe IslandsFijiFinlandFranceFrench PolynesiaGabonGambia, TheGeorgiaGermanyGhanaGreeceGreenlandGrenadaGuamGuatemalaGuineaGuinea-BissauGuyanaHaitiHondurasHong Kong SAR, ChinaHungaryIcelandIndiaIndonesiaIran, Islamic Rep.IraqIrelandIsle of ManIsraelItalyJamaicaJapanJordanKazakhstanKenyaKiribatiKorea, Dem. People’s Rep.Korea, Rep.KosovoKuwaitKyrgyz RepublicLao PDRLatviaLebanonLesothoLiberiaLibyaLiechtensteinLithuaniaLuxembourgMacedonia, FYRMadagascarMalawiMalaysiaMaldivesMaliMaltaMarshall IslandsMauritaniaMauritiusMexicoMicronesia, Fed. Sts.MoldovaMongoliaMontenegroMoroccoMozambiqueMyanmarNamibiaNepalNetherlandsNew CaledoniaNew ZealandNicaraguaNigerNigeriaNorthern Mariana IslandsNorwayOmanPakistanPalauPanamaPapua New GuineaParaguayPeruPhilippinesPolandPortugalPuerto RicoQatarRomaniaRussian FederationRwandaSamoaSan MarinoSao Tome and PrincipeSaudi ArabiaSenegalSerbiaSeychellesSierra LeoneSingaporeSlovak RepublicSloveniaSolomon IslandsSomaliaSouth AfricaSpainSri LankaSt. Kitts and NevisSt. LuciaSt. Vincent and the GrenadinesSudanSurinameSwazilandSwedenSwitzerlandSyrian Arab RepublicTajikistanTanzaniaThailandTimor-LesteTogoTongaTrinidad and TobagoTunisiaTurkeyTurkmenistanTurks and Caicos IslandsUgandaUkraineUnited Arab EmiratesUnited KingdomUnited StatesUruguayUzbekistanVanuatuVenezuela, RBVietnamVirgin Islands (U.S.)West Bank and GazaYemen, Rep.ZambiaZimbabwe Timeline:
This timeline shows a graph from 1986 to 2015 of Greenland. No data until 1985. Number of actual observations by date: 30.
Source name:
World Development Indicators
Source organization:
Food and Agriculture Organization, electronic files and web site.
Categories, topics:
Agriculture & Rural Development
Last updated:
apr 23, 2017
Indicators value changes by year
At the date of observation
Value
Absolute change
Change from previous value
jan 1, 1986
400.0
+400.0
0.0%
jan 1, 1987
400.0
0.0
0.0%
jan 1, 1988
400.0
0.0
0.0%
jan 1, 1989
400.0
0.0
0.0%
jan 1, 1990
400.0
0.0
0.0%
jan 1, 1991
500.0
+100.0
25.0%
jan 1, 1992
500.0
0.0
0.0%
jan 1, 1993
600.0
+100.0
20.0%
jan 1, 1994
600.0
0.0
0.0%
jan 1, 1995
600.0
0.0
0.0%
jan 1, 1996
600.0
0.0
0.0%
jan 1, 1997
700.0
+100.0
16.67%
jan 1, 1998
700.0
0.0
0.0%
jan 1, 1999
700.0
0.0
0.0%
jan 1, 2000
700.0
0.0
0.0%
jan 1, 2001
800.0
+100.0
14.29%
jan 1, 2002
800.0
0.0
0.0%
jan 1, 2003
900.0
+100.0
12.5%
jan 1, 2004
900.0
0.0
0.0%
jan 1, 2005
900.0
0.0
0.0%
jan 1, 2006
900.0
0.0
0.0%
jan 1, 2007
900.0
0.0
0.0%
jan 1, 2008
900.0
0.0
0.0%
jan 1, 2009
900.0
0.0
0.0%
jan 1, 2010
900.0
0.0
0.0%
jan 1, 2011
900.0
0.0
0.0%
jan 1, 2012
900.0
0.0
0.0%
jan 1, 2013
900.0
0.0
0.0%
jan 1, 2014
900.0
0.0
0.0%
jan 1, 2015
900.0
0.0
0.0%
Ranking of countries by current statistics by years


Comments: