29
/
en
AIzaSyAYiBZKx7MnpbEhh9jyipgxe19OcubqV5w
April 1, 2024
207693
Netherlands
NLD
true
2
1
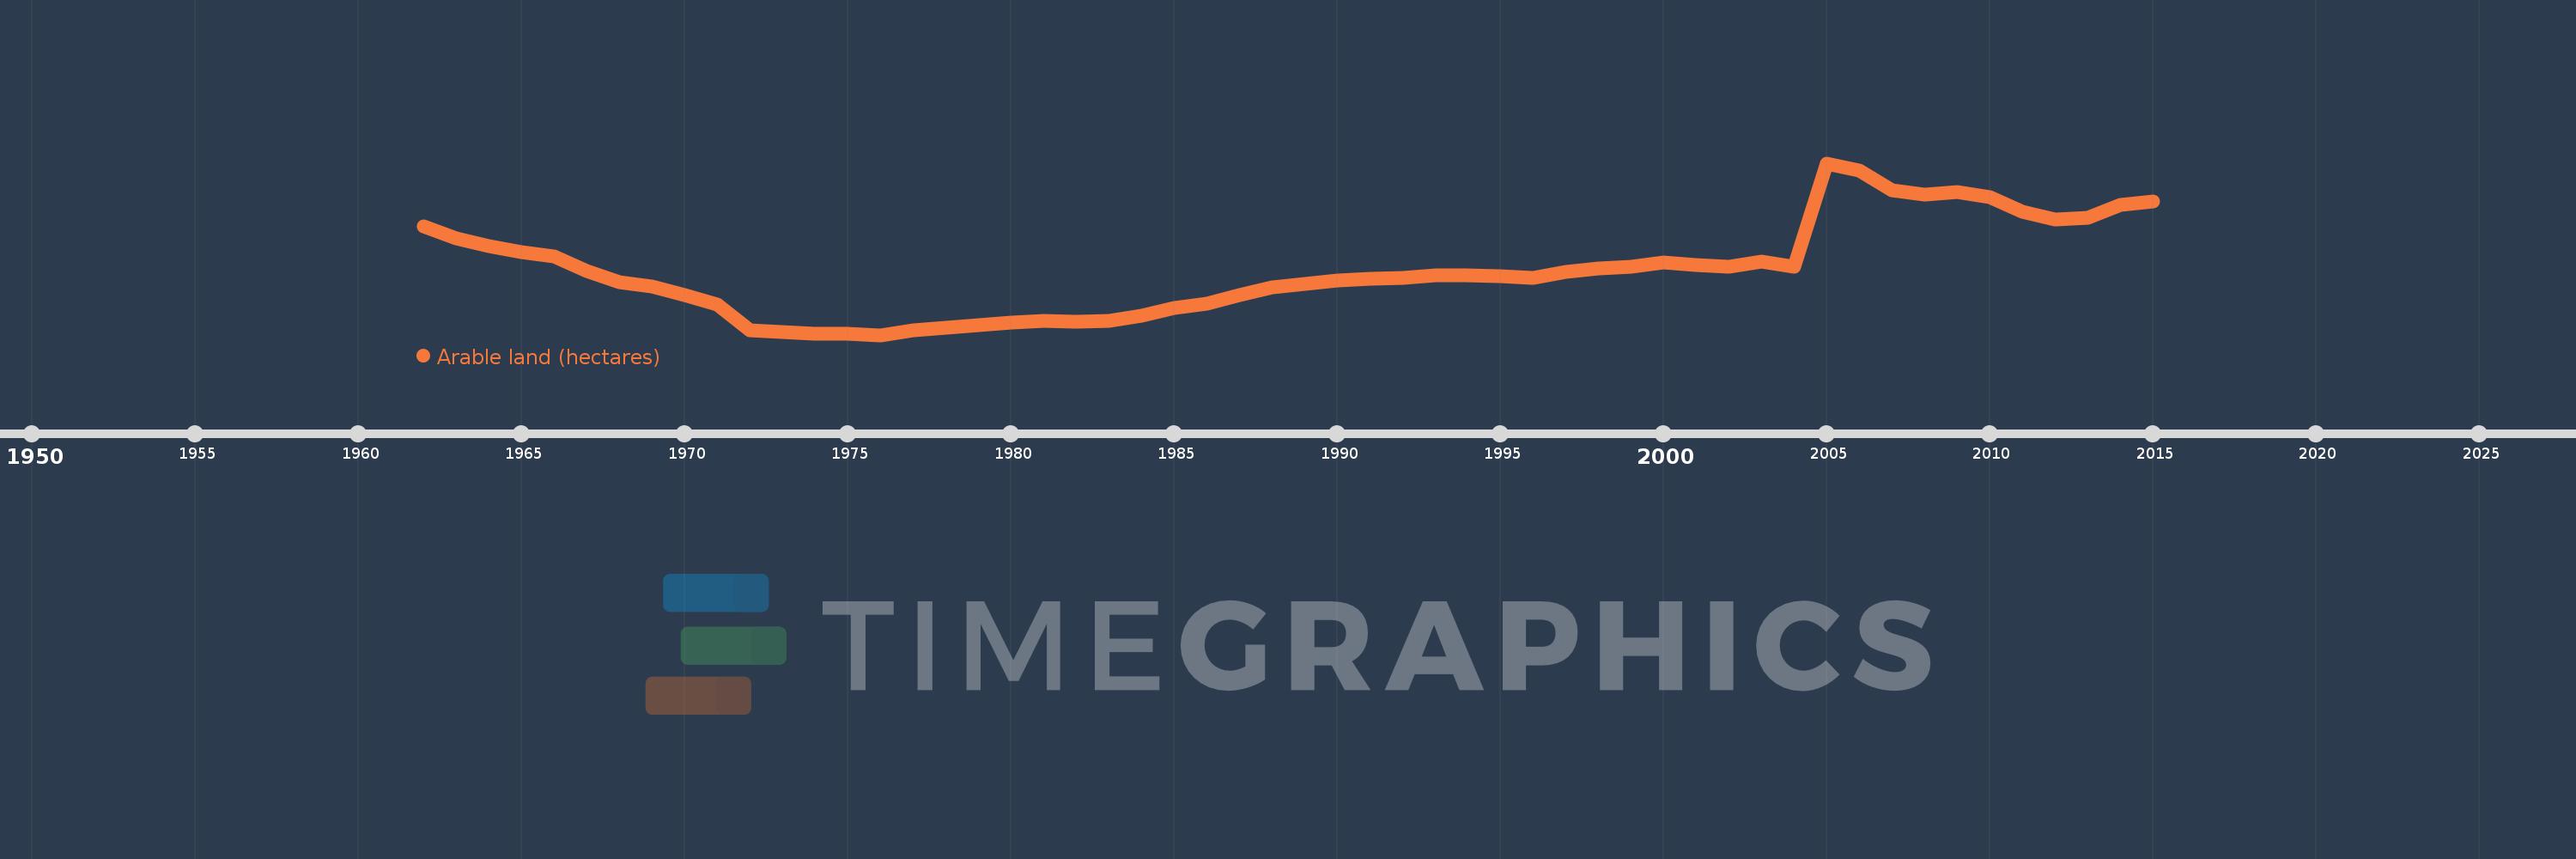
Arable land (hectares)
2015,2014,2013,2012,2011,2010,2009,2008,2007,2006,2005,2004,2003,2002,2001,2000,1999,1998,1997,1996,1995,1994,1993,1992,1991,1990,1989,1988,1987,1986,1985,1984,1983,1982,1981,1980,1979,1978,1977,1976,1975,1974,1973,1972,1971,1970,1969,1968,1967,1966,1965,1964,1963,1962
This statistics in other country:
AfghanistanAlbaniaAlgeriaAmerican SamoaAndorraAngolaAntigua and BarbudaArgentinaArmeniaArubaAustraliaAustriaAzerbaijanBahamas, TheBahrainBangladeshBarbadosBelarusBelgiumBelizeBeninBermudaBhutanBoliviaBosnia and HerzegovinaBotswanaBrazilBritish Virgin IslandsBrunei DarussalamBulgariaBurkina FasoBurundiCabo VerdeCambodiaCameroonCanadaCayman IslandsCentral African RepublicChadChannel IslandsChileChinaColombiaComorosCongo, Dem. Rep.Congo, Rep.Costa RicaCote d'IvoireCroatiaCubaCyprusCzech RepublicDenmarkDjiboutiDominicaDominican RepublicEcuadorEgypt, Arab Rep.El SalvadorEquatorial GuineaEritreaEstoniaEthiopiaFaroe IslandsFijiFinlandFranceFrench PolynesiaGabonGambia, TheGeorgiaGermanyGhanaGreeceGreenlandGrenadaGuamGuatemalaGuineaGuinea-BissauGuyanaHaitiHondurasHong Kong SAR, ChinaHungaryIcelandIndiaIndonesiaIran, Islamic Rep.IraqIrelandIsle of ManIsraelItalyJamaicaJapanJordanKazakhstanKenyaKiribatiKorea, Dem. People’s Rep.Korea, Rep.KosovoKuwaitKyrgyz RepublicLao PDRLatviaLebanonLesothoLiberiaLibyaLiechtensteinLithuaniaLuxembourgMacedonia, FYRMadagascarMalawiMalaysiaMaldivesMaliMaltaMarshall IslandsMauritaniaMauritiusMexicoMicronesia, Fed. Sts.MoldovaMongoliaMontenegroMoroccoMozambiqueMyanmarNamibiaNepalNetherlandsNew CaledoniaNew ZealandNicaraguaNigerNigeriaNorthern Mariana IslandsNorwayOmanPakistanPalauPanamaPapua New GuineaParaguayPeruPhilippinesPolandPortugalPuerto RicoQatarRomaniaRussian FederationRwandaSamoaSan MarinoSao Tome and PrincipeSaudi ArabiaSenegalSerbiaSeychellesSierra LeoneSingaporeSlovak RepublicSloveniaSolomon IslandsSomaliaSouth AfricaSpainSri LankaSt. Kitts and NevisSt. LuciaSt. Vincent and the GrenadinesSudanSurinameSwazilandSwedenSwitzerlandSyrian Arab RepublicTajikistanTanzaniaThailandTimor-LesteTogoTongaTrinidad and TobagoTunisiaTurkeyTurkmenistanTurks and Caicos IslandsUgandaUkraineUnited Arab EmiratesUnited KingdomUnited StatesUruguayUzbekistanVanuatuVenezuela, RBVietnamVirgin Islands (U.S.)West Bank and GazaYemen, Rep.ZambiaZimbabwe Timeline:
This timeline shows a graph from 1962 to 2015 of Netherlands. No data until 1961. Number of actual observations by date: 54.
Source name:
World Development Indicators
Source organization:
Food and Agriculture Organization, electronic files and web site.
Categories, topics:
Agriculture & Rural Development
Last updated:
apr 23, 2017
Indicators value changes by year
Minimum:
759.0K
jan 1, 1976
Maximum:
1.127 mln
jan 1, 2005
At the date of observation
Value
Absolute change
Change from previous value
jan 1, 1962
992.0K
+992.0K
0.0%
jan 1, 1963
966.0K
-26.0K
-2.62%
jan 1, 1964
949.0K
-17.0K
-1.76%
jan 1, 1965
937.0K
-12.0K
-1.26%
jan 1, 1966
928.0K
-9.0K
-0.96%
jan 1, 1967
897.0K
-31.0K
-3.34%
jan 1, 1968
873.0K
-24.0K
-2.68%
jan 1, 1969
864.0K
-9.0K
-1.03%
jan 1, 1970
845.0K
-19.0K
-2.2%
jan 1, 1971
824.0K
-21.0K
-2.49%
jan 1, 1972
770.0K
-54.0K
-6.55%
jan 1, 1973
765.0K
-5.0K
-0.65%
jan 1, 1974
761.0K
-4.0K
-0.52%
jan 1, 1975
762.0K
+1000.0
0.13%
jan 1, 1976
759.0K
-3.0K
-0.39%
jan 1, 1977
769.0K
+10.0K
1.32%
jan 1, 1978
775.0K
+6.0K
0.78%
jan 1, 1979
780.0K
+5.0K
0.65%
jan 1, 1980
785.0K
+5.0K
0.64%
jan 1, 1981
790.0K
+5.0K
0.64%
jan 1, 1982
788.0K
-2.0K
-0.25%
jan 1, 1983
790.0K
+2.0K
0.25%
jan 1, 1984
801.0K
+11.0K
1.39%
jan 1, 1985
817.0K
+16.0K
2.0%
jan 1, 1986
826.0K
+9.0K
1.1%
jan 1, 1987
844.0K
+18.0K
2.18%
jan 1, 1988
861.0K
+17.0K
2.01%
jan 1, 1989
869.0K
+8.0K
0.93%
jan 1, 1990
876.0K
+7.0K
0.81%
jan 1, 1991
879.0K
+3.0K
0.34%
jan 1, 1992
881.0K
+2.0K
0.23%
jan 1, 1993
887.0K
+6.0K
0.68%
jan 1, 1994
887.0K
0.0
0.0%
jan 1, 1995
885.0K
-2.0K
-0.23%
jan 1, 1996
882.0K
-3.0K
-0.34%
jan 1, 1997
895.0K
+13.0K
1.47%
jan 1, 1998
901.0K
+6.0K
0.67%
jan 1, 1999
906.0K
+5.0K
0.55%
jan 1, 2000
914.0K
+8.0K
0.88%
jan 1, 2001
910.0K
-4.0K
-0.44%
jan 1, 2002
905.0K
-5.0K
-0.55%
jan 1, 2003
916.0K
+11.0K
1.22%
jan 1, 2004
906.0K
-10.0K
-1.09%
jan 1, 2005
1.127 mln
+221.5K
24.45%
jan 1, 2006
1.111 mln
-16.5K
-1.46%
jan 1, 2007
1.07 mln
-41.2K
-3.71%
jan 1, 2008
1.06 mln
-10.0K
-0.93%
jan 1, 2009
1.067 mln
+6.8K
0.64%
jan 1, 2010
1.055 mln
-11.9K
-1.12%
jan 1, 2011
1.023 mln
-32.1K
-3.04%
jan 1, 2012
1.006 mln
-16.6K
-1.62%
jan 1, 2013
1.011 mln
+5.0K
0.5%
jan 1, 2014
1.038 mln
+27.4K
2.71%
jan 1, 2015
1.045 mln
+6.6K
0.64%
Ranking of countries by current statistics by years


Comments: