29
/
en
AIzaSyAYiBZKx7MnpbEhh9jyipgxe19OcubqV5w
April 1, 2024
230682
Rwanda
RWA
true
2
1
Arable land (hectares)
2015,2014,2013,2012,2011,2010,2009,2008,2007,2006,2005,2004,2003,2002,2001,2000,1999,1998,1997,1996,1995,1994,1993,1992,1991,1990,1989,1988,1987,1986,1985,1984,1983,1982,1981,1980,1979,1978,1977,1976,1975,1974,1973,1972,1971,1970,1969,1968,1967,1966,1965,1964,1963,1962
This statistics in other country:
AfghanistanAlbaniaAlgeriaAmerican SamoaAndorraAngolaAntigua and BarbudaArgentinaArmeniaArubaAustraliaAustriaAzerbaijanBahamas, TheBahrainBangladeshBarbadosBelarusBelgiumBelizeBeninBermudaBhutanBoliviaBosnia and HerzegovinaBotswanaBrazilBritish Virgin IslandsBrunei DarussalamBulgariaBurkina FasoBurundiCabo VerdeCambodiaCameroonCanadaCayman IslandsCentral African RepublicChadChannel IslandsChileChinaColombiaComorosCongo, Dem. Rep.Congo, Rep.Costa RicaCote d'IvoireCroatiaCubaCyprusCzech RepublicDenmarkDjiboutiDominicaDominican RepublicEcuadorEgypt, Arab Rep.El SalvadorEquatorial GuineaEritreaEstoniaEthiopiaFaroe IslandsFijiFinlandFranceFrench PolynesiaGabonGambia, TheGeorgiaGermanyGhanaGreeceGreenlandGrenadaGuamGuatemalaGuineaGuinea-BissauGuyanaHaitiHondurasHong Kong SAR, ChinaHungaryIcelandIndiaIndonesiaIran, Islamic Rep.IraqIrelandIsle of ManIsraelItalyJamaicaJapanJordanKazakhstanKenyaKiribatiKorea, Dem. People’s Rep.Korea, Rep.KosovoKuwaitKyrgyz RepublicLao PDRLatviaLebanonLesothoLiberiaLibyaLiechtensteinLithuaniaLuxembourgMacedonia, FYRMadagascarMalawiMalaysiaMaldivesMaliMaltaMarshall IslandsMauritaniaMauritiusMexicoMicronesia, Fed. Sts.MoldovaMongoliaMontenegroMoroccoMozambiqueMyanmarNamibiaNepalNetherlandsNew CaledoniaNew ZealandNicaraguaNigerNigeriaNorthern Mariana IslandsNorwayOmanPakistanPalauPanamaPapua New GuineaParaguayPeruPhilippinesPolandPortugalPuerto RicoQatarRomaniaRussian FederationRwandaSamoaSan MarinoSao Tome and PrincipeSaudi ArabiaSenegalSerbiaSeychellesSierra LeoneSingaporeSlovak RepublicSloveniaSolomon IslandsSomaliaSouth AfricaSpainSri LankaSt. Kitts and NevisSt. LuciaSt. Vincent and the GrenadinesSudanSurinameSwazilandSwedenSwitzerlandSyrian Arab RepublicTajikistanTanzaniaThailandTimor-LesteTogoTongaTrinidad and TobagoTunisiaTurkeyTurkmenistanTurks and Caicos IslandsUgandaUkraineUnited Arab EmiratesUnited KingdomUnited StatesUruguayUzbekistanVanuatuVenezuela, RBVietnamVirgin Islands (U.S.)West Bank and GazaYemen, Rep.ZambiaZimbabwe Timeline:
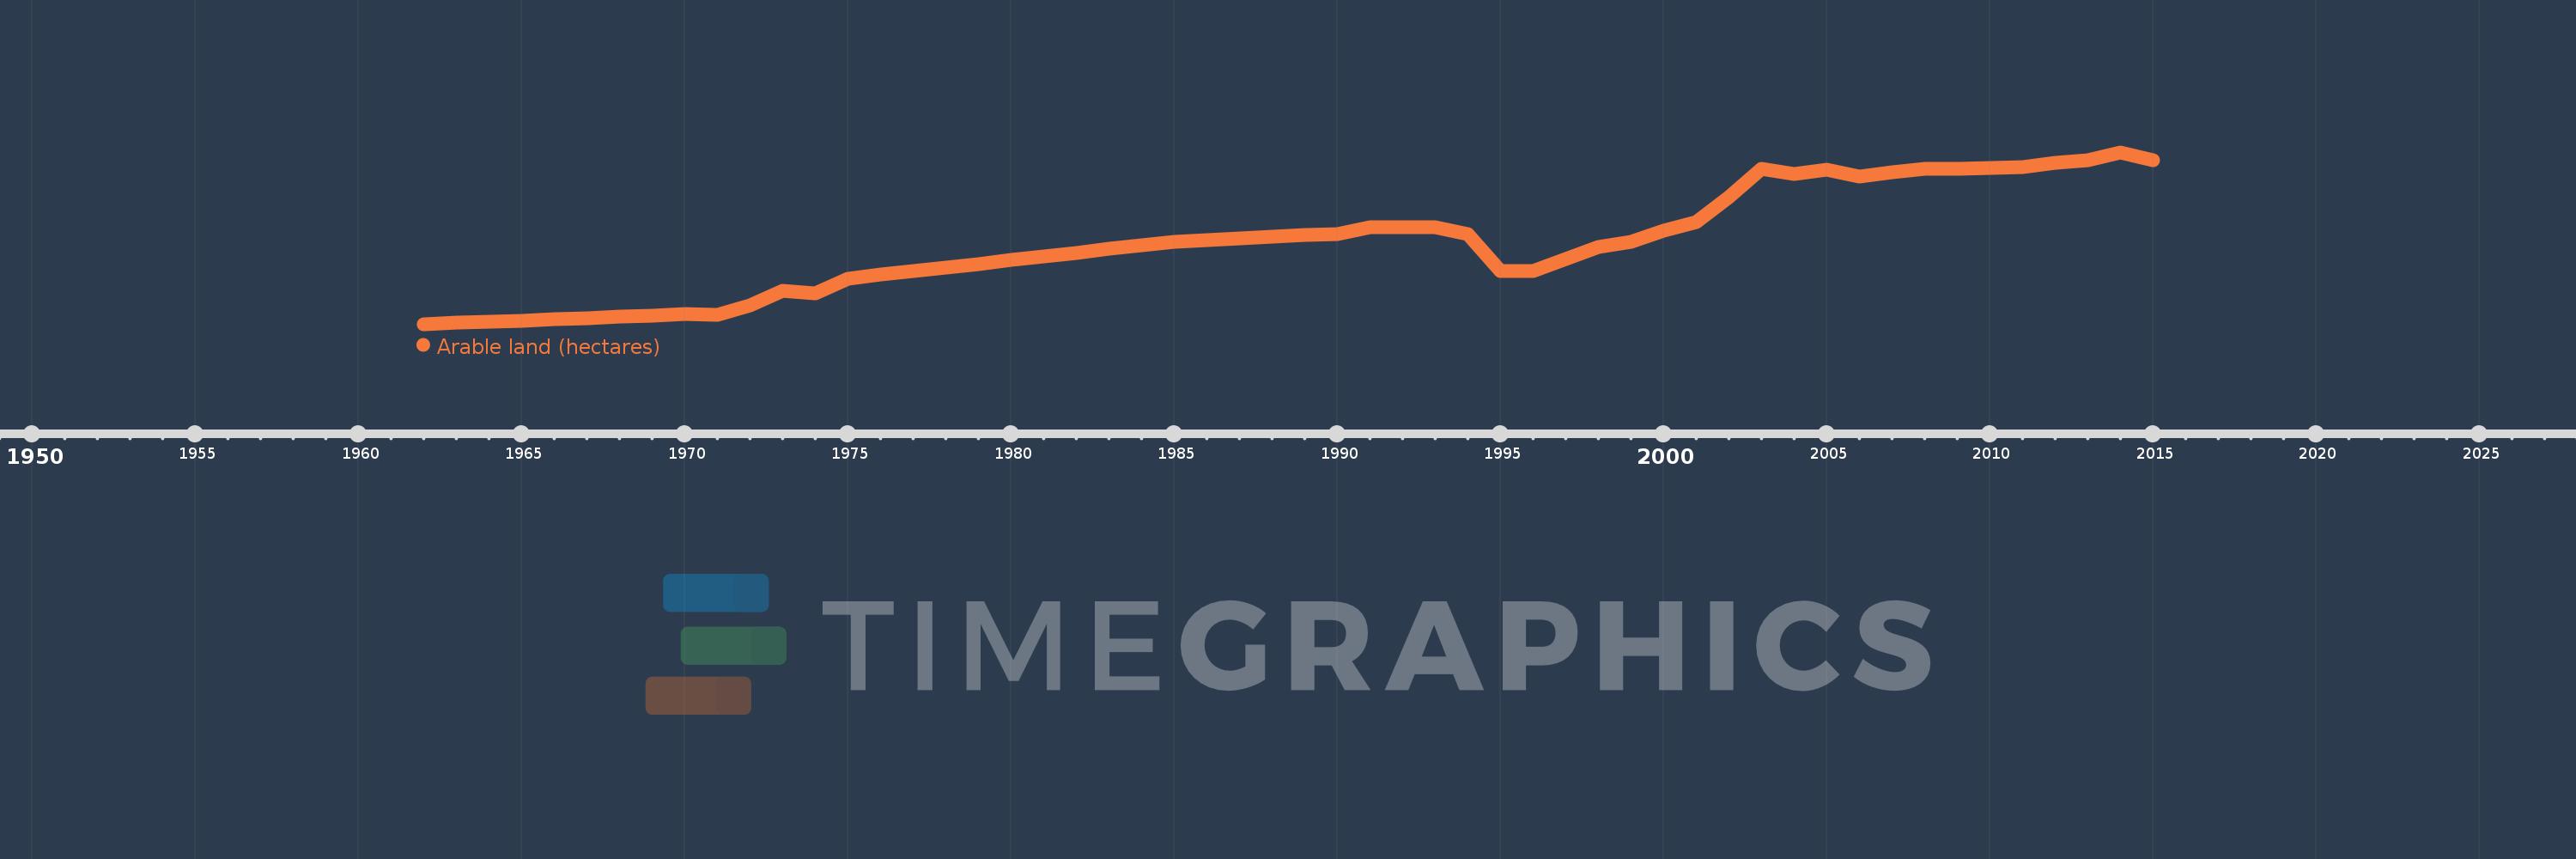
This timeline shows a graph from 1962 to 2015 of Rwanda. No data until 1961. Number of actual observations by date: 54.
Source name:
World Development Indicators
Source organization:
Food and Agriculture Organization, electronic files and web site.
Categories, topics:
Agriculture & Rural Development
Last updated:
apr 23, 2017
Indicators value changes by year
Minimum:
485.0K
jan 1, 1962
Maximum:
1.183 mln
jan 1, 2014
At the date of observation
Value
Absolute change
Change from previous value
jan 1, 1962
485.0K
+485.0K
0.0%
jan 1, 1963
490.0K
+5.0K
1.03%
jan 1, 1964
495.0K
+5.0K
1.02%
jan 1, 1965
500.0K
+5.0K
1.01%
jan 1, 1966
505.0K
+5.0K
1.0%
jan 1, 1967
510.0K
+5.0K
0.99%
jan 1, 1968
515.0K
+5.0K
0.98%
jan 1, 1969
521.0K
+6.0K
1.17%
jan 1, 1970
528.0K
+7.0K
1.34%
jan 1, 1971
522.0K
-6.0K
-1.14%
jan 1, 1972
560.0K
+38.0K
7.28%
jan 1, 1973
621.0K
+61.0K
10.89%
jan 1, 1974
610.0K
-11.0K
-1.77%
jan 1, 1975
668.0K
+58.0K
9.51%
jan 1, 1976
686.0K
+18.0K
2.69%
jan 1, 1977
700.0K
+14.0K
2.04%
jan 1, 1978
715.0K
+15.0K
2.14%
jan 1, 1979
730.0K
+15.0K
2.1%
jan 1, 1980
745.0K
+15.0K
2.05%
jan 1, 1981
760.0K
+15.0K
2.01%
jan 1, 1982
775.0K
+15.0K
1.97%
jan 1, 1983
790.0K
+15.0K
1.94%
jan 1, 1984
805.0K
+15.0K
1.9%
jan 1, 1985
820.0K
+15.0K
1.86%
jan 1, 1986
827.0K
+7.0K
0.85%
jan 1, 1987
834.0K
+7.0K
0.85%
jan 1, 1988
842.0K
+8.0K
0.96%
jan 1, 1989
849.0K
+7.0K
0.83%
jan 1, 1990
850.0K
+1000.0
0.12%
jan 1, 1991
880.0K
+30.0K
3.53%
jan 1, 1992
880.0K
0.0
0.0%
jan 1, 1993
880.0K
0.0
0.0%
jan 1, 1994
850.0K
-30.0K
-3.41%
jan 1, 1995
700.0K
-150.0K
-17.65%
jan 1, 1996
700.0K
0.0
0.0%
jan 1, 1997
750.0K
+50.0K
7.14%
jan 1, 1998
800.0K
+50.0K
6.67%
jan 1, 1999
820.0K
+20.0K
2.5%
jan 1, 2000
866.0K
+46.0K
5.61%
jan 1, 2001
900.0K
+34.0K
3.93%
jan 1, 2002
1000.0K
+100.0K
11.11%
jan 1, 2003
1.116 mln
+116.0K
11.6%
jan 1, 2004
1.094 mln
-22.0K
-1.97%
jan 1, 2005
1.111 mln
+16.88K
1.54%
jan 1, 2006
1.083 mln
-27.98K
-2.52%
jan 1, 2007
1.103 mln
+20.05K
1.85%
jan 1, 2008
1.115 mln
+11.93K
1.08%
jan 1, 2009
1.117 mln
+2.56K
0.23%
jan 1, 2010
1.119 mln
+1.43K
0.13%
jan 1, 2011
1.124 mln
+5.05K
0.45%
jan 1, 2012
1.141 mln
+17.52K
1.56%
jan 1, 2013
1.151 mln
+9.29K
0.81%
jan 1, 2014
1.183 mln
+31.77K
2.76%
jan 1, 2015
1.149 mln
-33.0K
-2.79%
Ranking of countries by current statistics by years


Comments: