29
/
en
AIzaSyAYiBZKx7MnpbEhh9jyipgxe19OcubqV5w
April 1, 2024
254619
Suriname
SUR
true
2
1
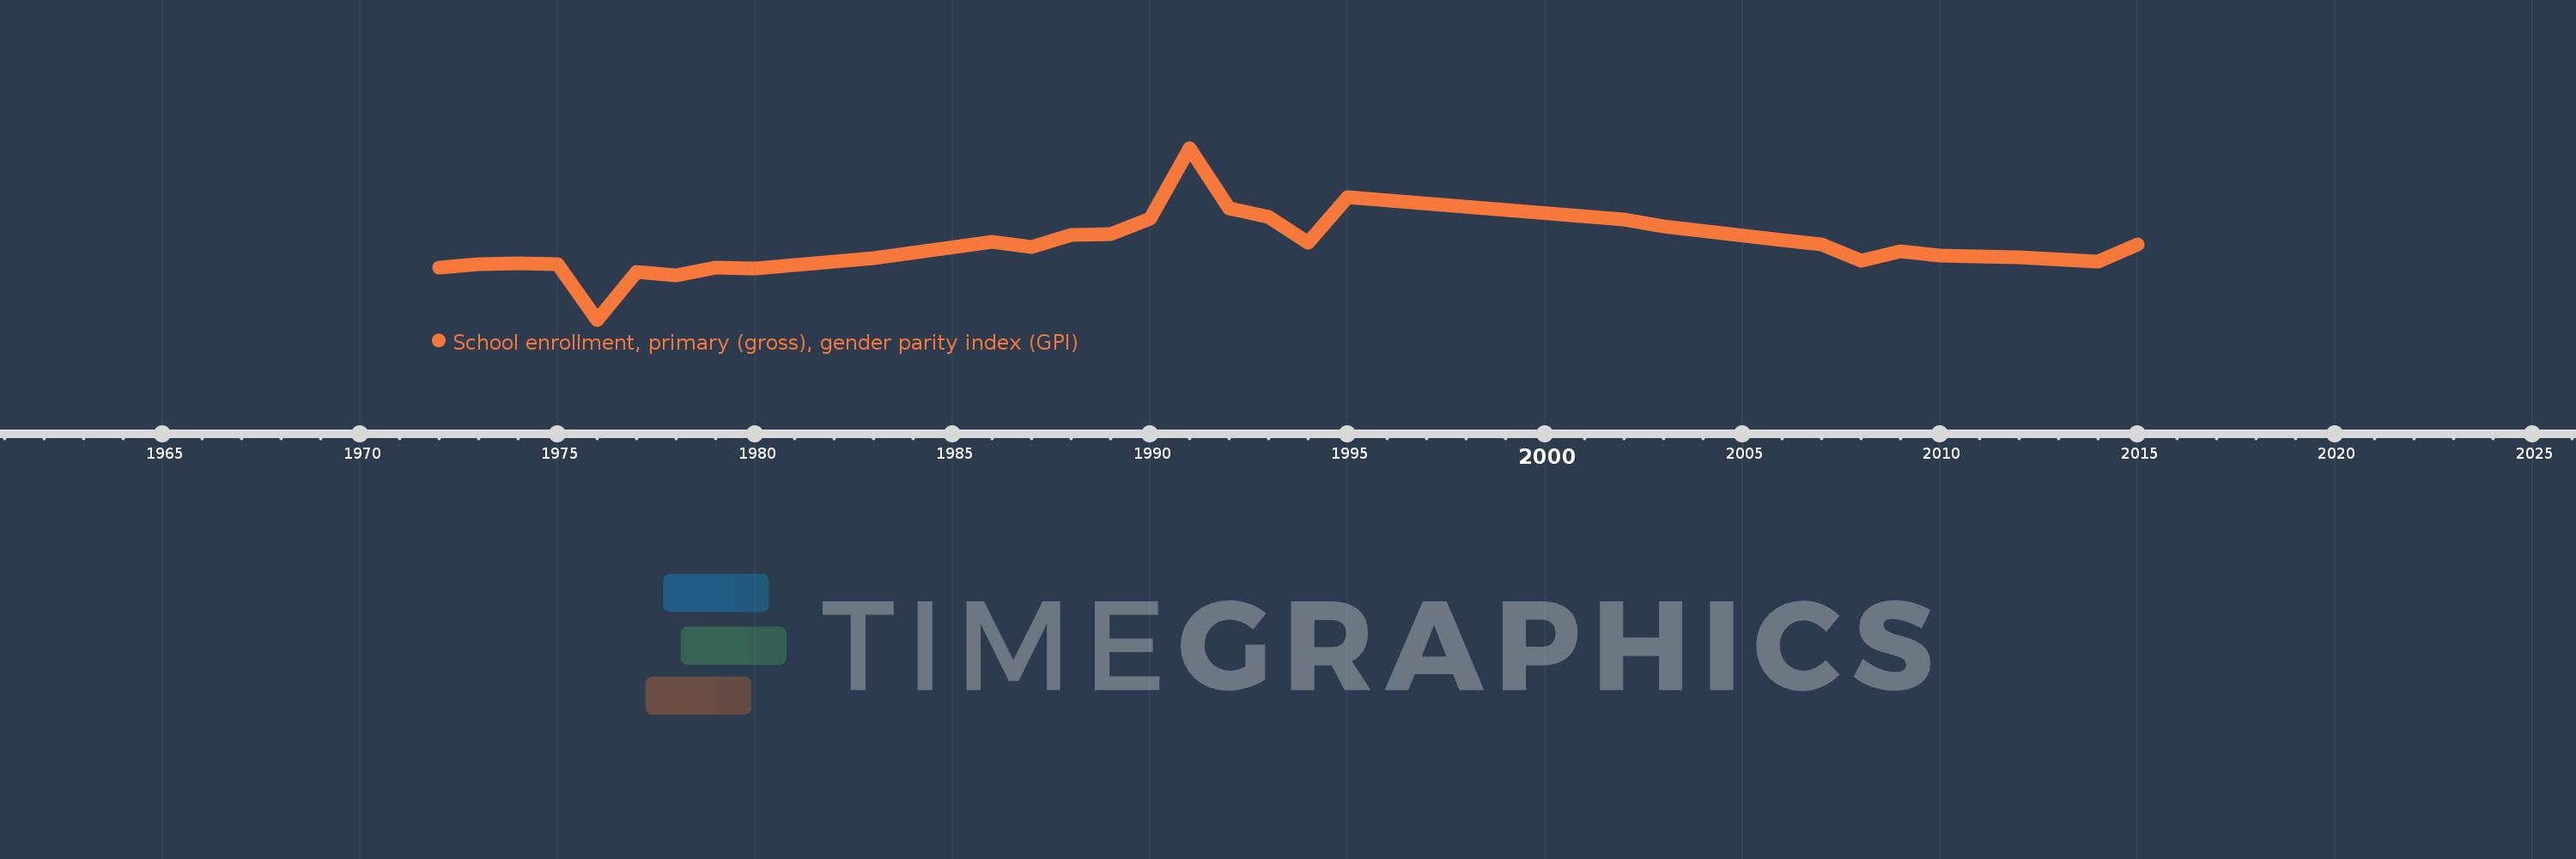
School enrollment, primary (gross), gender parity index (GPI)
2015,2014,2012,2010,2009,2008,2007,2006,2003,2002,1995,1994,1993,1992,1991,1990,1989,1988,1987,1986,1983,1980,1979,1978,1977,1976,1975,1974,1973,1972
This statistics in other country:
AfghanistanAlbaniaAlgeriaAndorraAngolaAntigua and BarbudaArab WorldArgentinaArmeniaArubaAustraliaAustriaAzerbaijanBahamas, TheBahrainBangladeshBarbadosBelarusBelgiumBelizeBeninBermudaBhutanBoliviaBosnia and HerzegovinaBotswanaBrazilBrunei DarussalamBulgariaBurkina FasoBurundiCabo VerdeCambodiaCameroonCanadaCaribbean small statesCentral African RepublicCentral Europe and the BalticsChadChileChinaColombiaComorosCongo, Dem. Rep.Congo, Rep.Costa RicaCote d'IvoireCroatiaCubaCuracaoCyprusCzech RepublicDenmarkDjiboutiDominicaDominican RepublicEarly-demographic dividendEast Asia & PacificEast Asia & Pacific (excluding high income)East Asia & Pacific (IDA & IBRD countries)EcuadorEgypt, Arab Rep.El SalvadorEquatorial GuineaEritreaEstoniaEthiopiaEuro areaEurope & Central AsiaEurope & Central Asia (excluding high income)Europe & Central Asia (IDA & IBRD countries)European UnionFijiFinlandFragile and conflict affected situationsFranceGabonGambia, TheGeorgiaGermanyGhanaGreeceGrenadaGuatemalaGuineaGuinea-BissauGuyanaHaitiHeavily indebted poor countries (HIPC)High incomeHondurasHong Kong SAR, ChinaHungaryIBRD onlyIcelandIDA & IBRD totalIDA blendIDA onlyIDA totalIndiaIndonesiaIran, Islamic Rep.IraqIrelandIsraelItalyJamaicaJapanJordanKazakhstanKenyaKiribatiKorea, Dem. People’s Rep.Korea, Rep.KuwaitKyrgyz RepublicLao PDRLate-demographic dividendLatin America & Caribbean Latin America & Caribbean (excluding high income)Latin America & the Caribbean (IDA & IBRD countries)LatviaLeast developed countries: UN classificationLebanonLesothoLiberiaLibyaLiechtensteinLithuaniaLow & middle incomeLow incomeLower middle incomeLuxembourgMacao SAR, ChinaMacedonia, FYRMadagascarMalawiMaldivesMaliMaltaMarshall IslandsMauritaniaMauritiusMexicoMicronesia, Fed. Sts.Middle East & North AfricaMiddle East & North Africa (excluding high income)Middle East & North Africa (IDA & IBRD countries)Middle incomeMoldovaMongoliaMontenegroMoroccoMozambiqueMyanmarNamibiaNauruNepalNetherlandsNew ZealandNicaraguaNigerNigeriaNorth AmericaNorwayOECD membersOmanOther small statesPacific island small statesPakistanPalauPanamaPapua New GuineaParaguayPeruPhilippinesPolandPortugalPost-demographic dividendPre-demographic dividendPuerto RicoQatarRomaniaRussian FederationRwandaSamoaSan MarinoSao Tome and PrincipeSaudi ArabiaSenegalSerbiaSeychellesSierra LeoneSlovak RepublicSloveniaSmall statesSolomon IslandsSomaliaSouth AfricaSouth AsiaSouth Asia (IDA & IBRD)South SudanSpainSri LankaSt. Kitts and NevisSt. LuciaSt. Vincent and the GrenadinesSub-Saharan Africa Sub-Saharan Africa (excluding high income)Sub-Saharan Africa (IDA & IBRD countries)SudanSurinameSwazilandSwedenSwitzerlandSyrian Arab RepublicTajikistanTanzaniaThailandTimor-LesteTogoTongaTrinidad and TobagoTunisiaTurkeyTurkmenistanTuvaluUgandaUkraineUnited Arab EmiratesUnited KingdomUnited StatesUpper middle incomeUruguayUzbekistanVanuatuVenezuela, RBVietnamWest Bank and GazaWorldYemen, Rep.ZambiaZimbabwe Timeline:
This timeline shows a graph from 1972 to 2015 of Suriname. No data until 1971. Number of actual observations by date: 30.
Source name:
World Development Indicators
Source organization:
United Nations Educational, Scientific, and Cultural Organization (UNESCO) Institute for Statistics.
Categories, topics:
Education, Gender, Social Development
Last updated:
apr 23, 2017
Indicators value changes by year
At the date of observation
Value
Absolute change
Change from previous value
jan 1, 1972
0.942
+0.942
0.0%
jan 1, 1973
0.946
+0.004
0.45%
jan 1, 1974
0.948
+0.001
0.14%
jan 1, 1975
0.947
0.0
-0.03%
jan 1, 1976
0.874
-0.073
-7.75%
jan 1, 1977
0.936
+0.062
7.12%
jan 1, 1978
0.932
-0.004
-0.47%
jan 1, 1979
0.942
+0.01
1.12%
jan 1, 1980
0.941
-0.002
-0.18%
jan 1, 1983
0.954
+0.013
1.39%
jan 1, 1986
0.976
+0.022
2.36%
jan 1, 1987
0.969
-0.007
-0.71%
jan 1, 1988
0.984
+0.015
1.54%
jan 1, 1989
0.986
+0.002
0.24%
jan 1, 1990
1.006
+0.019
1.97%
jan 1, 1991
1.098
+0.092
9.14%
jan 1, 1992
1.019
-0.078
-7.14%
jan 1, 1993
1.008
-0.011
-1.07%
jan 1, 1994
0.975
-0.033
-3.29%
jan 1, 1995
1.034
+0.059
6.05%
jan 1, 2002
1.005
-0.029
-2.85%
jan 1, 2003
0.996
-0.009
-0.93%
jan 1, 2006
0.978
-0.018
-1.76%
jan 1, 2007
0.972
-0.006
-0.59%
jan 1, 2008
0.951
-0.021
-2.13%
jan 1, 2009
0.963
+0.012
1.23%
jan 1, 2010
0.958
-0.006
-0.57%
jan 1, 2012
0.955
-0.003
-0.32%
jan 1, 2014
0.95
-0.005
-0.53%
jan 1, 2015
0.972
+0.023
2.4%
Ranking of countries by current statistics by years


Comments: