29
/
en
AIzaSyAYiBZKx7MnpbEhh9jyipgxe19OcubqV5w
April 1, 2024
193655
Mauritania
MRT
true
2
1
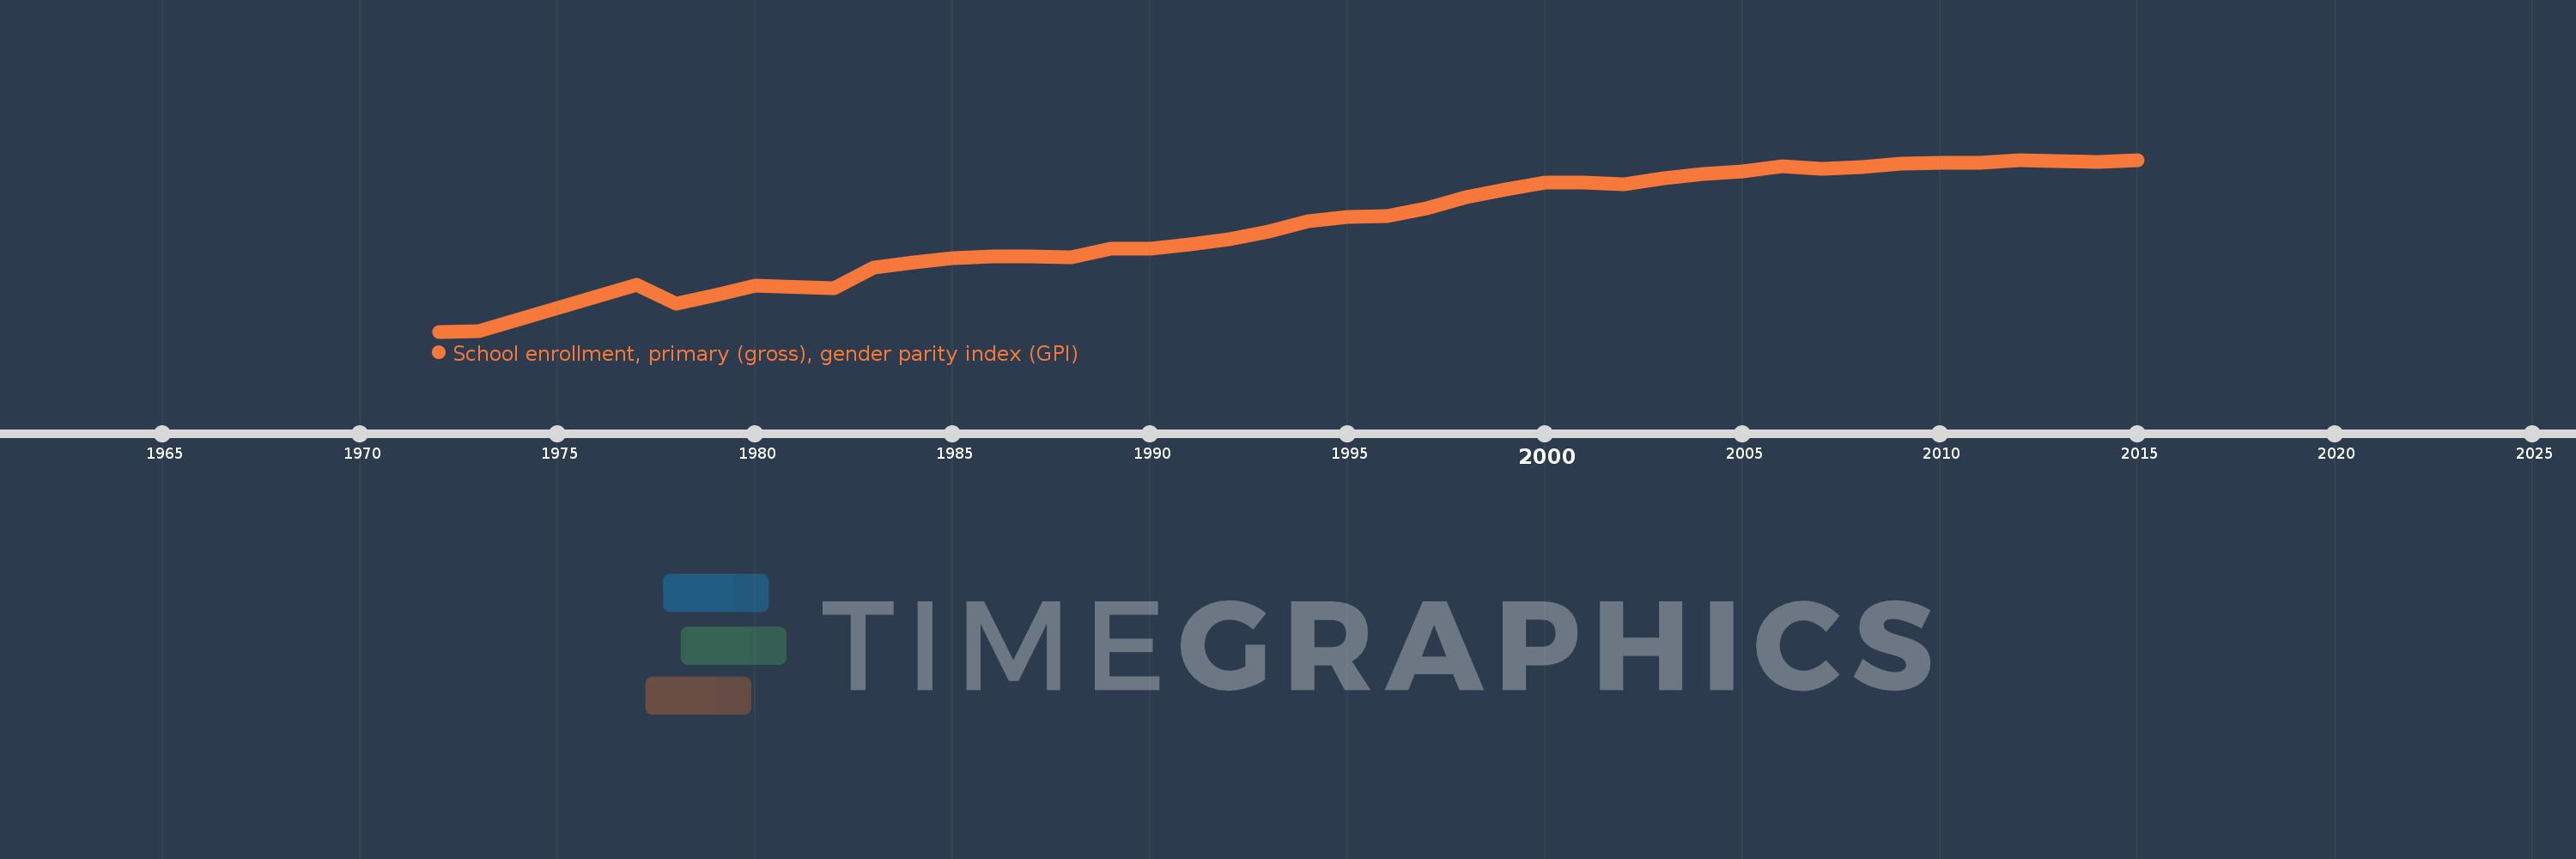
School enrollment, primary (gross), gender parity index (GPI)
2015,2014,2013,2012,2011,2010,2009,2008,2007,2006,2005,2004,2003,2002,2001,2000,1999,1998,1997,1996,1995,1994,1993,1992,1991,1990,1989,1988,1987,1986,1985,1984,1983,1982,1980,1979,1978,1977,1973,1972
This statistics in other country:
AfghanistanAlbaniaAlgeriaAndorraAngolaAntigua and BarbudaArab WorldArgentinaArmeniaArubaAustraliaAustriaAzerbaijanBahamas, TheBahrainBangladeshBarbadosBelarusBelgiumBelizeBeninBermudaBhutanBoliviaBosnia and HerzegovinaBotswanaBrazilBrunei DarussalamBulgariaBurkina FasoBurundiCabo VerdeCambodiaCameroonCanadaCaribbean small statesCentral African RepublicCentral Europe and the BalticsChadChileChinaColombiaComorosCongo, Dem. Rep.Congo, Rep.Costa RicaCote d'IvoireCroatiaCubaCuracaoCyprusCzech RepublicDenmarkDjiboutiDominicaDominican RepublicEarly-demographic dividendEast Asia & PacificEast Asia & Pacific (excluding high income)East Asia & Pacific (IDA & IBRD countries)EcuadorEgypt, Arab Rep.El SalvadorEquatorial GuineaEritreaEstoniaEthiopiaEuro areaEurope & Central AsiaEurope & Central Asia (excluding high income)Europe & Central Asia (IDA & IBRD countries)European UnionFijiFinlandFragile and conflict affected situationsFranceGabonGambia, TheGeorgiaGermanyGhanaGreeceGrenadaGuatemalaGuineaGuinea-BissauGuyanaHaitiHeavily indebted poor countries (HIPC)High incomeHondurasHong Kong SAR, ChinaHungaryIBRD onlyIcelandIDA & IBRD totalIDA blendIDA onlyIDA totalIndiaIndonesiaIran, Islamic Rep.IraqIrelandIsraelItalyJamaicaJapanJordanKazakhstanKenyaKiribatiKorea, Dem. People’s Rep.Korea, Rep.KuwaitKyrgyz RepublicLao PDRLate-demographic dividendLatin America & Caribbean Latin America & Caribbean (excluding high income)Latin America & the Caribbean (IDA & IBRD countries)LatviaLeast developed countries: UN classificationLebanonLesothoLiberiaLibyaLiechtensteinLithuaniaLow & middle incomeLow incomeLower middle incomeLuxembourgMacao SAR, ChinaMacedonia, FYRMadagascarMalawiMaldivesMaliMaltaMarshall IslandsMauritaniaMauritiusMexicoMicronesia, Fed. Sts.Middle East & North AfricaMiddle East & North Africa (excluding high income)Middle East & North Africa (IDA & IBRD countries)Middle incomeMoldovaMongoliaMontenegroMoroccoMozambiqueMyanmarNamibiaNauruNepalNetherlandsNew ZealandNicaraguaNigerNigeriaNorth AmericaNorwayOECD membersOmanOther small statesPacific island small statesPakistanPalauPanamaPapua New GuineaParaguayPeruPhilippinesPolandPortugalPost-demographic dividendPre-demographic dividendPuerto RicoQatarRomaniaRussian FederationRwandaSamoaSan MarinoSao Tome and PrincipeSaudi ArabiaSenegalSerbiaSeychellesSierra LeoneSlovak RepublicSloveniaSmall statesSolomon IslandsSomaliaSouth AfricaSouth AsiaSouth Asia (IDA & IBRD)South SudanSpainSri LankaSt. Kitts and NevisSt. LuciaSt. Vincent and the GrenadinesSub-Saharan Africa Sub-Saharan Africa (excluding high income)Sub-Saharan Africa (IDA & IBRD countries)SudanSurinameSwazilandSwedenSwitzerlandSyrian Arab RepublicTajikistanTanzaniaThailandTimor-LesteTogoTongaTrinidad and TobagoTunisiaTurkeyTurkmenistanTuvaluUgandaUkraineUnited Arab EmiratesUnited KingdomUnited StatesUpper middle incomeUruguayUzbekistanVanuatuVenezuela, RBVietnamWest Bank and GazaWorldYemen, Rep.ZambiaZimbabwe Timeline:
This timeline shows a graph from 1972 to 2015 of Mauritania. No data until 1971. Number of actual observations by date: 40.
Source name:
World Development Indicators
Source organization:
United Nations Educational, Scientific, and Cultural Organization (UNESCO) Institute for Statistics.
Categories, topics:
Education, Gender, Social Development
Last updated:
apr 23, 2017
Indicators value changes by year
At the date of observation
Value
Absolute change
Change from previous value
jan 1, 1972
0.401
+0.401
0.0%
jan 1, 1973
0.402
+0.002
0.39%
jan 1, 1977
0.58
+0.177
44.11%
jan 1, 1978
0.506
-0.074
-12.72%
jan 1, 1979
0.539
+0.033
6.48%
jan 1, 1980
0.577
+0.038
7.12%
jan 1, 1982
0.566
-0.011
-1.94%
jan 1, 1983
0.645
+0.079
13.91%
jan 1, 1984
0.664
+0.019
2.98%
jan 1, 1985
0.682
+0.018
2.76%
jan 1, 1986
0.687
+0.005
0.76%
jan 1, 1987
0.688
+0.0
0.06%
jan 1, 1988
0.683
-0.005
-0.71%
jan 1, 1989
0.717
+0.034
5.01%
jan 1, 1990
0.717
-0.001
-0.09%
jan 1, 1991
0.733
+0.017
2.34%
jan 1, 1992
0.754
+0.02
2.79%
jan 1, 1993
0.781
+0.027
3.58%
jan 1, 1994
0.823
+0.042
5.38%
jan 1, 1995
0.837
+0.014
1.67%
jan 1, 1996
0.843
+0.007
0.78%
jan 1, 1997
0.871
+0.028
3.29%
jan 1, 1998
0.914
+0.043
4.9%
jan 1, 1999
0.944
+0.03
3.29%
jan 1, 2000
0.969
+0.025
2.66%
jan 1, 2001
0.97
+0.001
0.08%
jan 1, 2002
0.962
-0.007
-0.77%
jan 1, 2003
0.986
+0.024
2.46%
jan 1, 2004
1.002
+0.016
1.6%
jan 1, 2005
1.011
+0.01
0.95%
jan 1, 2006
1.033
+0.021
2.12%
jan 1, 2007
1.023
-0.009
-0.89%
jan 1, 2008
1.029
+0.006
0.57%
jan 1, 2009
1.041
+0.012
1.18%
jan 1, 2010
1.046
+0.005
0.45%
jan 1, 2011
1.044
-0.002
-0.22%
jan 1, 2012
1.053
+0.009
0.9%
jan 1, 2013
1.051
-0.002
-0.21%
jan 1, 2014
1.048
-0.003
-0.25%
jan 1, 2015
1.056
+0.008
0.72%
Ranking of countries by current statistics by years


Comments: