30
/
AIzaSyAYiBZKx7MnpbEhh9jyipgxe19OcubqV5w
April 1, 2024
234163
Sao Tome and Principe
STP
true
2
1
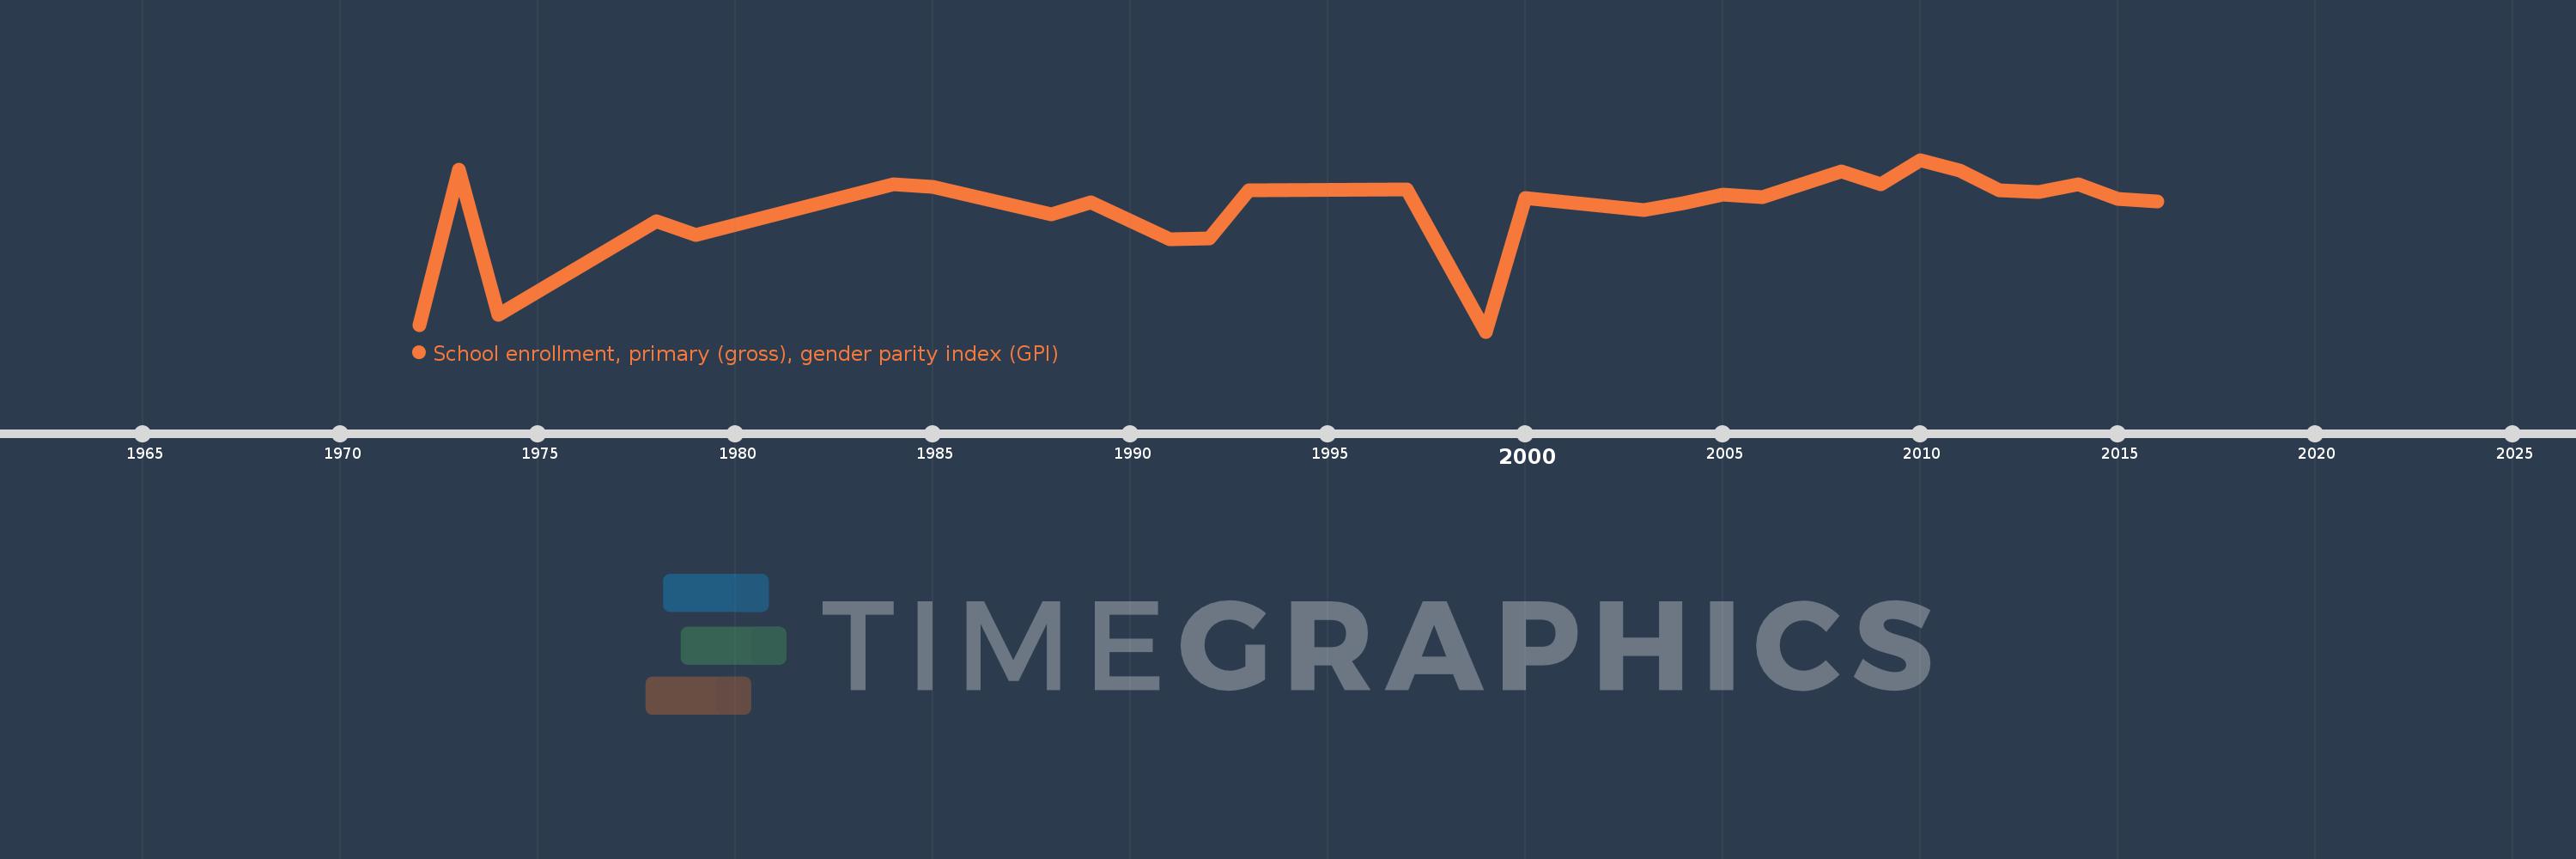
School enrollment, primary (gross), gender parity index (GPI)
2016,2015,2014,2013,2012,2011,2010,2009,2008,2006,2005,2004,2003,2000,1999,1997,1993,1992,1991,1989,1988,1985,1984,1979,1978,1974,1973,1972
